「PythonとJavaScriptではじめるデータビジュアライゼーション」を読む

12.2静的ファイルの配信

フォルダ構成
viz/  
    data/  
        nobel_winners.json
    index.html
    script.js

#index.html
<!DOCTYPE html>
<meta charset="utf-8">
<style>
    body{font-family: sans-serif;}
</style>

<h2 id='data-title'></h2>
<div id='data'>
    <pre></pre>
</div>

<script src="http://d3js.org/d3.v3.min.js"></script>
<script src="script.js"></script>

#script.js
d3.json('data/nobel_winners_plus_bornin.json',function(error,data){
    if(error){
        console.log(error);
    }
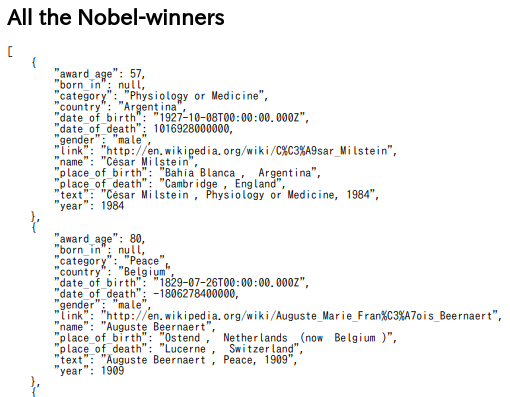
    d3.select('h2#data-title').text('All the Nobel-winners');
    d3.select('div#data pre').html(JSON.stringify(data,null,4));
});

シエル上でpython -m http.serverで待機状態にする。
Webブラウザーhttp://localhost:8000にアクセスすると

f:id:bitop:20171015095155p:plain

国別に受賞者リストを分ける

ファイルを分割する

フォルダ構成
viz/  
    data/  
        nobel_winners.json
        winners_by_country/
    index.html
    script.js

#group_by_country.py
import pandas as pd

df_winners = pd.read_json('data/nobel_winners_plus_bornin.json')
for name,group in df_winners.groupby('country'):
    group.to_json('data/winners_by_country/' + name + '.json',orient='records')

winners_by_countryフォルダ下に国別のjsonファイルができる。

script.jsを書き換える

#script.js
var loadCountryWinnersJSON = function(country){
    d3.json('data/winners_by_country/' + country + '.json', 
        function(error, data) {
            if (error) {
                console.log(error);
            }
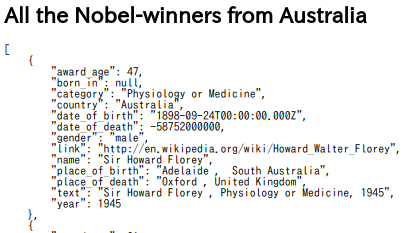
            d3.select('h2#data-title').text('All the Nobel-winners from ' + country);
            d3.select('div#data pre').html(JSON.stringify(data, null, 4));
        });
};

loadCountryWinnersJSON('Australia');

シエル上でpython -m http.serverで待機状態にする。
Webブラウザーhttp://localhost:8000にアクセスすると

f:id:bitop:20171015104020p:plain

「PythonとJavaScriptではじめるデータビジュアライゼーション」を読む

12.1 データ配信

#nobel_viz.py
from flask import Flask
app = Flask(__name__)

@app.route("/")
def hello():
    return "Hello world!"

if __name__ == "__main__":
    app.run(port=8000,debug=True)

nobel_viz.pyがあるフォルダで
$ python nobel_viz.py
と実行させると

d-js/data$ python nobel_viz.py 
 * Running on http://127.0.0.1:8000/ (Press CTRL+C to quit)
 * Restarting with stat
 * Debugger is active!
 * Debugger PIN: 186-114-981

と表示され待機状態になる。
Webブラウザのアドレス欄にhttp://localhost:8000と入力して
アクセスさせるとHello world!と表示される。  

Jinja2を使ったテンプレート
フォルダ構成
nobel_viz.py  
  templates/  
    testj2.html  


from flask import Flask,render_template

app = Flask(__name__)
winners = [
    {'name':'Albert Einstein','category':'Physics'},
    {'name':'V. S. Naipaul','category':'Literature'},
    {'name':'Dorothy Hodgkin','category':'Chemistry'}
]

@app.route("/")
def hello():
    return "Hello world!"

@app.route("/demolist")
def demo_list():
    return render_template('testj2.html',heading="A little winners list",winners = winners)

if __name__ == "__main__":
    app.run(port=8000,debug=True)

#testj2.html
<!DOCTYPE html>
<meta charset="utf-8">
<body>
    <h2>{{ heading }}</h2> #/があるとエラーがでるので除外した
    <ul>
        {% for winner in winners %}
        <li><a href="{{ 'http://wikipedia.com/wiki/'+winner.name }}">
        {{ winner.name }}</a>
        {{ ', category: ' + winner.category}}
        </li>
        {% endfor %}
    </ul>
</body>

nobel_viz.pyがあるフォルダで python nobel_viz.pyと実行
さきほどと同じように待機状態になる

Webブラウザのアドレス欄にhttp://localhost:8000/demolistと入力して
アクセスさせると

f:id:bitop:20171014113946p:plain

となる。リンク先をクリックさせるとWikiに飛んでいく。

「PythonとJavaScriptではじめるデータビジュアライゼーション」を読む

11.5 受賞者の年齢と没年齢

df['award_age'].hist(bins=20)
<matplotlib.axes._subplots.AxesSubplot at 0x7f1459757978>

[f:id:bitop:20171009090400p:plain]

sns.distplot(df['award_age'])
<matplotlib.axes._subplots.AxesSubplot at 0x7f1458f80fd0>

png

箱ひげ図
sns.boxplot(df.gender,df.award_age)
plt.show()
sns.violinplot(df.gender,df.award_age)
plt.show()

png

png

11.5.2 受賞者の没年齢
df['age_at_death'] = (df.date_of_death - df.date_of_birth).dt.days/365
age_at_death = df[df.age_at_death.notnull()].age_at_death
sns.distplot(age_at_death,bins=40)
<matplotlib.axes._subplots.AxesSubplot at 0x7f14596b5668>

png

100歳以上の受賞者
df[df.age_at_death > 100][['name','category','year']]
name category year
101 Ronald Coase Economics 1991
329 Rita Levi-Montalcini Physiology or Medicine 1986
男性と女性の寿命の差
df2 = df[df.age_at_death.notnull()]
sns.kdeplot(df2[df2.gender == 'male'].age_at_death,shade=True,label='male')
sns.kdeplot(df2[df2.gender == 'female'].age_at_death,shade=True,label='female')
<matplotlib.axes._subplots.AxesSubplot at 0x7f1457f58400>

png

sns.violinplot(df.gender,age_at_death)
<matplotlib.axes._subplots.AxesSubplot at 0x7f1457f40828>

png

11.5.3 時代に伴う寿命の延長
df_temp = df[df.age_at_death.notnull()]
data = pd.DataFrame({'age_at_death':df_temp.age_at_death,
                    'date_of_birth':df_temp.date_of_birth.dt.year})
sns.lmplot('date_of_birth','age_at_death',data,size=6,aspect=1.5)
<seaborn.axisgrid.FacetGrid at 0x7f1457da0d30>

png

11.6 受賞者の移住

#birth_inフィールド付のjsonファイルを読み込み、今までのdfにはbirth_in列はないので11.6章は実行できなかった
df = pd.read_json('nobel_winners_plus_bornin.json', orient='records')
by_bornin_nat = df[df.born_in.notnull()].groupby(['born_in','country']).size().unstack()
by_bornin_nat.index.name = 'Born_in'
by_bornin_nat.columns.name = 'Move_to'
plt.figure(figsize= (8,8))
ax=sns.heatmap(by_bornin_nat,vmin=0,vmax=8)
ax.set_title('The Nobel Diaspora')
<matplotlib.text.Text at 0x7f1417def080>

png


「PythonとJavaScriptではじめるデータビジュアライゼーション」を読む

11.1 探索の開始

import pandas as pd
import numpy as np
import matplotlib.pyplot as plt
import json
import seaborn as sb

%matplotlib inline
plt.rcParams['figure.figsize'] = 8,4
#Mongoデータベースがうまく動かないのでjsonファイルをDataFrameに読み込ませる
df = pd.DataFrame(pd.read_json('nobel_winners_cleaned.json'))
print(df.info())
<class 'pandas.core.frame.DataFrame'>
Int64Index: 858 entries, 0 to 857
Data columns (total 12 columns):
award_age         858 non-null int64
category          858 non-null object
country           858 non-null object
date_of_birth     858 non-null object
date_of_death     559 non-null object
gender            858 non-null object
link              858 non-null object
name              858 non-null object
place_of_birth    831 non-null object
place_of_death    524 non-null object
text              858 non-null object
year              858 non-null int64
dtypes: int64(2), object(10)
memory usage: 87.1+ KB
None

date_of_birthとdate_of_deathをobject型からdatetime型に変換する

df.date_of_birth = pd.to_datetime(df.date_of_birth)
df.date_of_death = pd.to_datetime(df.date_of_death)
df.info('data_of_death')
<class 'pandas.core.frame.DataFrame'>
Int64Index: 858 entries, 0 to 857
Data columns (total 12 columns):
award_age         858 non-null int64
category          858 non-null object
country           858 non-null object
date_of_birth     858 non-null datetime64[ns]
date_of_death     559 non-null datetime64[ns]
gender            858 non-null object
link              858 non-null object
name              858 non-null object
place_of_birth    831 non-null object
place_of_death    524 non-null object
text              858 non-null object
year              858 non-null int64
dtypes: datetime64[ns](2), int64(2), object(8)
memory usage: 87.1+ KB

11.2 pandasを使ったプロット

by_gender = df.groupby('gender')
print(by_gender.size())
print(type(by_gender.size()))
by_gender.size().plot(kind='bar') #Seriesデータに対しplotメソッドを実行している
gender
female     47
male      811
dtype: int64

[f:id:bitop:20171008101748p:plain]

11.3 男女間の格差

by_cat_gen = df.groupby(['category','gender'])
print(type(by_cat_gen.get_group(('Physics','female'))))
by_cat_gen.get_group(('Physics','female'))[['name','year']] #物理賞を取った女性の名前と受賞年を取得
<class 'pandas.core.frame.DataFrame'>
name year
267 Maria Goeppert-Mayer 1963
614 Marie Skłodowska-Curie 1903
#女性受賞者はPeace,Literature(文学賞)、Physiology or Medicine(生理学及び医学賞)におおい
print(by_cat_gen.size())
by_cat_gen.size().plot(kind="barh")
plt.show()
#縦軸でも
by_cat_gen.size().plot(kind="bar")
category                gender
Chemistry               female      4
                        male      167
Economics               female      1
                        male       74
Literature              female     13
                        male       93
Peace                   female     16
                        male       87
Physics                 female      2
                        male      199
Physiology or Medicine  female     11
                        male      191
dtype: int64

[f:id:bitop:20171008101837p:plain] [f:id:bitop:20171008101816p:plain]

<matplotlib.axes._subplots.AxesSubplot at 0x7efce45467f0>

png

11.3.1 グループのアンスタック
by_cat_gen.size().unstack().plot(kind="barh")
<matplotlib.axes._subplots.AxesSubplot at 0x7efce1f9bcf8>

png

性別グループの並び替えと合計
cat_gen_sz = by_cat_gen.size().unstack()
print(cat_gen_sz,"\n",type(cat_gen_sz))
cat_gen_sz['total'] = cat_gen_sz.sum(axis=1) #cat_gen_sz(DataFrame)を列方向(性別方向)に合計をとってtotal列に代入する
cat_gen_sz = cat_gen_sz.sort_values(by = 'female',ascending=True)
cat_gen_sz[['female','total','male']].plot(kind='barh')
gender                  female  male
category                            
Chemistry                    4   167
Economics                    1    74
Literature                  13    93
Peace                       16    87
Physics                      2   199
Physiology or Medicine      11   191 
 <class 'pandas.core.frame.DataFrame'>


<matplotlib.axes._subplots.AxesSubplot at 0x7efce1e67588>

png

11.3.2 歴史的傾向
by_year_gender = df.groupby(['year','gender'])
year_gen_sz = by_year_gender.size().unstack()
year_gen_sz.plot(kind = 'bar',figsize=(16,4))
<matplotlib.axes._subplots.AxesSubplot at 0x7efce1e77278>

png

x軸ラベルの削減
def thin_xticks(ax,tick_gap=10,rotation=45):
    #x軸を減らして回転を調整する
    ticks = ax.xaxis.get_ticklocs() #xaxisはtickに関するobject
    ticklabels = [l.get_text() for l in ax.xaxis.get_ticklabels()]
    ax.xaxis.set_ticks(ticks[::tick_gap])
    ax.xaxis.set_ticklabels(ticklabels[::tick_gap],rotation=rotation)
    ax.figure.show()
    
new_index = pd.Index(np.arange(1901,2015),name='year')
by_year_gender = df.groupby(['year','gender'])
year_gen_sz = by_year_gender.size().unstack().reindex(new_index)
year_gen_sz.plot(kind = 'bar',figsize=(16,4))
thin_xticks(year_gen_sz.plot(kind="bar",figsize=(16,4)))
/home/beetle/anaconda3/lib/python3.6/site-packages/matplotlib/figure.py:403: UserWarning: matplotlib is currently using a non-GUI backend, so cannot show the figure
  "matplotlib is currently using a non-GUI backend, "

png

png

上下に並べた年ごとの性別での受賞者数
new_index = pd.Index(np.arange(1901,2015),name='year')
by_year_gender = df.groupby(['year','gender'])
year_gen_sz = by_year_gender.size().unstack().reindex(new_index)

fig,axes = plt.subplots(nrows=2,ncols=1,sharex=True,sharey=True)
ax_f = axes[0]
ax_m = axes[1]

fig.suptitle('Nobel Prize-winners by gender',fontsize=16)
ax_f.bar(year_gen_sz.index,year_gen_sz.female)
ax_f.set_ylabel('Female winner')
ax_m.bar(year_gen_sz.index,year_gen_sz.male)
ax_m.set_ylabel('male winner')
<matplotlib.text.Text at 0x7efce0a5edd8>

png

11.4 国の傾向

#orderメソッドを使うとそのようなものはないとエラーがでるのでsort_valuesメッソドを使用
#ascending=Falseは降順でソートの指定
df.groupby('country').size().sort_values(ascending=False).plot(kind='bar',figsize=(12,4))
#受賞した国数は
print(len(df.groupby('country'))) #56国 wikiによれは世界全体の国家数は206なので残り150国はノーベル受賞者を出していない
56

png

ノーベル賞データ可視化のための国データの取得

MogoDBがうまく動かないのでwinning_country_data.jsonファイルから直接DataFrame化する

df_countries = pd.DataFrame(pd.read_json('winning_country_data.json'))
print(df_countries.info())
print(df_countries['Argentina'])
#本とは列と行が逆になっている,行列を転置する
df_countries = df_countries.T
print(df_countries.info())
print(df_countries.ix[0])
<class 'pandas.core.frame.DataFrame'>
Index: 7 entries, alpha3Code to population
Data columns (total 57 columns):
Argentina                7 non-null object
Australia                7 non-null object
Austria                  7 non-null object
Azerbaijan               7 non-null object
Bangladesh               7 non-null object
Belgium                  7 non-null object
Canada                   7 non-null object
Chile                    7 non-null object
China                    7 non-null object
Colombia                 7 non-null object
Costa Rica               7 non-null object
Cyprus                   6 non-null object
Czech Republic           7 non-null object
Denmark                  7 non-null object
East Timor               7 non-null object
Egypt                    7 non-null object
Finland                  7 non-null object
France                   7 non-null object
Germany                  7 non-null object
Ghana                    7 non-null object
Greece                   7 non-null object
Guatemala                7 non-null object
Hungary                  7 non-null object
Iceland                  6 non-null object
India                    7 non-null object
Iran                     7 non-null object
Ireland                  7 non-null object
Israel                   7 non-null object
Italy                    7 non-null object
Japan                    7 non-null object
Kenya                    7 non-null object
Korea, South             7 non-null object
Liberia                  7 non-null object
Macedonia                7 non-null object
Mexico                   7 non-null object
Myanmar (Burma)          6 non-null object
Netherlands              7 non-null object
Nigeria                  7 non-null object
Norway                   7 non-null object
Pakistan                 7 non-null object
Palestinian Territory    6 non-null object
Poland                   7 non-null object
Portugal                 7 non-null object
Russia                   7 non-null object
Saint Lucia              7 non-null object
South Africa             7 non-null object
Spain                    7 non-null object
Sweden                   7 non-null object
Switzerland              7 non-null object
Taiwan                   6 non-null object
Turkey                   7 non-null object
United Kingdom           7 non-null object
United States            7 non-null object
Venezuela                7 non-null object
Vietnam                  7 non-null object
Yemen                    7 non-null object
Yugoslavia               7 non-null object
dtypes: object(57)
memory usage: 3.2+ KB
None
alpha3Code               ARG
area              2.7804e+06
capital         Buenos Aires
gini                    44.5
latlng        [-34.0, -64.0]
name               Argentina
population          42669500
Name: Argentina, dtype: object
<class 'pandas.core.frame.DataFrame'>
Index: 57 entries, Argentina to Yugoslavia
Data columns (total 7 columns):
alpha3Code    57 non-null object
area          56 non-null object
capital       57 non-null object
gini          53 non-null object
latlng        57 non-null object
name          57 non-null object
population    57 non-null object
dtypes: object(7)
memory usage: 6.1+ KB
None
alpha3Code               ARG
area              2.7804e+06
capital         Buenos Aires
gini                    44.5
latlng        [-34.0, -64.0]
name               Argentina
population          42669500
Name: Argentina, dtype: object


/home/beetle/anaconda3/lib/python3.6/site-packages/ipykernel_launcher.py:7: DeprecationWarning: 
.ix is deprecated. Please use
.loc for label based indexing or
.iloc for positional indexing

See the documentation here:
http://pandas.pydata.org/pandas-docs/stable/indexing.html#deprecate_ix
  import sys
1人当たりの国別のノーベル受賞者数
#本の上から9行目df.countriesではエラーがでるdf_countriesと変更
#print(df_countries)
nat_group = df.groupby('country')
ngsz = nat_group.size() #国別の受賞者数
#print(ngsz)
#df_countries = df_countries.set_index('name')
df_countries['nobel_wins'] = ngsz
df_countries['nobel_wins_per_capita'] = df_countries.nobel_wins / df_countries.population
#print(df_countries)
df_countries.sort_values(by='nobel_wins_per_capita',ascending=False).nobel_wins_per_capita.plot(kind='bar',figsize=(16,4))
<matplotlib.axes._subplots.AxesSubplot at 0x7efce14de908>

png

ノーベル賞3個以上受賞している国限定
df_countries[df_countries.nobel_wins > 2].sort_values(by='nobel_wins_per_capita',ascending=False).nobel_wins_per_capita.plot(kind='bar',figsize=(16,4))
<matplotlib.axes._subplots.AxesSubplot at 0x7efce1033f98>

png

11.4.1 分野別の受賞数
nat_cat_sz = df.groupby(['country','category']).size().unstack()
print(nat_cat_sz)
category               Chemistry  Economics  Literature  Peace  Physics  \
country                                                                   
Argentina                    1.0        NaN         NaN    2.0      NaN   
Australia                    NaN        1.0         1.0    NaN      1.0   
Austria                      3.0        1.0         1.0    2.0      4.0   
Azerbaijan                   NaN        NaN         NaN    NaN      1.0   
Bangladesh                   NaN        NaN         NaN    1.0      NaN   
Belgium                      1.0        NaN         1.0    3.0      1.0   
Canada                       4.0        1.0         1.0    1.0      2.0   
Chile                        NaN        NaN         2.0    NaN      NaN   
China                        NaN        NaN         1.0    2.0      2.0   
Colombia                     NaN        NaN         1.0    NaN      NaN   
Costa Rica                   NaN        NaN         NaN    1.0      NaN   
Cyprus                       NaN        1.0         NaN    NaN      NaN   
Czech Republic               1.0        NaN         1.0    NaN      NaN   
Denmark                      1.0        NaN         3.0    1.0      3.0   
East Timor                   NaN        NaN         NaN    2.0      NaN   
Egypt                        1.0        NaN         1.0    2.0      NaN   
Finland                      NaN        NaN         NaN    1.0      NaN   
France                       8.0        2.0        16.0    9.0     12.0   
Germany                     28.0        1.0         8.0    4.0     23.0   
Ghana                        NaN        NaN         NaN    1.0      NaN   
Greece                       NaN        NaN         2.0    NaN      NaN   
Guatemala                    NaN        NaN         1.0    1.0      NaN   
Hungary                      1.0        NaN         1.0    NaN      NaN   
Iceland                      NaN        NaN         1.0    NaN      NaN   
India                        NaN        NaN         1.0    2.0      1.0   
Iran                         NaN        NaN         NaN    1.0      NaN   
Ireland                      NaN        NaN         2.0    3.0      1.0   
Israel                       5.0        1.0         1.0    3.0      NaN   
Italy                        1.0        NaN         6.0    1.0      4.0   
Japan                        5.0        NaN         2.0    1.0      8.0   
Kenya                        NaN        NaN         NaN    1.0      NaN   
Korea, South                 NaN        NaN         NaN    1.0      NaN   
Liberia                      NaN        NaN         NaN    2.0      NaN   
Mexico                       NaN        NaN         1.0    1.0      NaN   
Myanmar (Burma)              NaN        NaN         NaN    1.0      NaN   
Netherlands                  3.0        2.0         NaN    1.0      9.0   
Nigeria                      NaN        NaN         1.0    NaN      NaN   
Norway                       1.0        3.0         3.0    2.0      NaN   
Pakistan                     NaN        NaN         NaN    1.0      1.0   
Palestinian Territory        NaN        NaN         NaN    1.0      NaN   
Poland                       NaN        NaN         3.0    1.0      1.0   
Portugal                     NaN        NaN         1.0    NaN      NaN   
Russia                       1.0        1.0         3.0    2.0      9.0   
Saint Lucia                  NaN        NaN         1.0    NaN      NaN   
South Africa                 NaN        NaN         2.0    4.0      NaN   
Spain                        NaN        NaN         5.0    NaN      NaN   
Sweden                       4.0        2.0         8.0    5.0      4.0   
Switzerland                  6.0        NaN         2.0    3.0      3.0   
Taiwan                       1.0        NaN         NaN    NaN      NaN   
Turkey                       NaN        NaN         1.0    NaN      NaN   
United Kingdom              26.0        6.0         9.0   10.0     22.0   
United States               69.0       53.0        11.0   21.0     89.0   
Venezuela                    NaN        NaN         NaN    NaN      NaN   
Vietnam                      NaN        NaN         NaN    1.0      NaN   
Yemen                        NaN        NaN         NaN    1.0      NaN   
Yugoslavia                   NaN        NaN         1.0    NaN      NaN   

category               Physiology or Medicine  
country                                        
Argentina                                 2.0  
Australia                                 6.0  
Austria                                   4.0  
Azerbaijan                                NaN  
Bangladesh                                NaN  
Belgium                                   4.0  
Canada                                    2.0  
Chile                                     NaN  
China                                     NaN  
Colombia                                  NaN  
Costa Rica                                NaN  
Cyprus                                    NaN  
Czech Republic                            NaN  
Denmark                                   5.0  
East Timor                                NaN  
Egypt                                     NaN  
Finland                                   NaN  
France                                   12.0  
Germany                                  16.0  
Ghana                                     NaN  
Greece                                    NaN  
Guatemala                                 NaN  
Hungary                                   1.0  
Iceland                                   NaN  
India                                     NaN  
Iran                                      NaN  
Ireland                                   NaN  
Israel                                    NaN  
Italy                                     1.0  
Japan                                     2.0  
Kenya                                     NaN  
Korea, South                              NaN  
Liberia                                   NaN  
Mexico                                    NaN  
Myanmar (Burma)                           NaN  
Netherlands                               2.0  
Nigeria                                   NaN  
Norway                                    2.0  
Pakistan                                  NaN  
Palestinian Territory                     NaN  
Poland                                    NaN  
Portugal                                  1.0  
Russia                                    2.0  
Saint Lucia                               NaN  
South Africa                              1.0  
Spain                                     1.0  
Sweden                                    6.0  
Switzerland                               9.0  
Taiwan                                    NaN  
Turkey                                    NaN  
United Kingdom                           27.0  
United States                            95.0  
Venezuela                                 1.0  
Vietnam                                   NaN  
Yemen                                     NaN  
Yugoslavia                                NaN  
#python3では割り算の結果が浮動小数点になるので/ではなく//を使う
#orderメソッドはないのでsort_valuesメソッドをつかう
COL_NUM = 2
ROW_NUM = 3
fig,axes = plt.subplots(ROW_NUM,COL_NUM,figsize = (12,12))
for i, (lable,col) in enumerate(nat_cat_sz.iteritems()):
    ax = axes[i//COL_NUM,i % COL_NUM]
    col = col.sort_values(ascending=False)[:10]
    col.plot(kind='barh',ax=ax)
    ax.set_title(lable)
    plt.tight_layout()

png

11.4.3 受賞分布の歴史的傾向
#国家:nation  別の訳としてはstate, country, homeland, sovereign state, kingdomがある
plt.rcParams['font.size'] = 20
new_index = pd.Index(np.arange(1901,2015),name='year')
by_year_nat_sz = df.groupby(['year','country']).size().unstack().reindex(new_index)
by_year_nat_sz['United States'].cumsum().plot(figsize=(16,4))
<matplotlib.axes._subplots.AxesSubplot at 0x7efce0bf8780>

png

日本の受賞者の歴史的傾向を見てみる

new_index = pd.Index(np.arange(1901,2015),name='year')
by_year_nat_sz = df.groupby(['year','country']).size().unstack().reindex(new_index)
by_year_nat_sz['Japan'].cumsum().plot(figsize=(16,4)) #ここのkeyをJapanに変えた
<matplotlib.axes._subplots.AxesSubplot at 0x7efce0010b38>

png

Nanを0に置換する
#fillnaメソッドは欠損値を引数の定数値に置換する
by_year_nat_sz['United States'].fillna(0).cumsum().plot(figsize=(16,4))
<matplotlib.axes._subplots.AxesSubplot at 0x7efce1465f28>

png

日本も0に置換してみる

new_index = pd.Index(np.arange(1901,2015),name='year')
by_year_nat_sz = df.groupby(['year','country']).size().unstack().reindex(new_index)

fig,axes = plt.subplots(2,1,figsize = (16,4))
#axes[0]の描画は大きいところだけ描画しているような?
by_year_nat_sz['Japan'].cumsum().plot(ax=axes[0])
by_year_nat_sz['Japan'].fillna(0).cumsum().plot(ax=axes[1])
<matplotlib.axes._subplots.AxesSubplot at 0x7efcdf9a2e10>

png

生データの表示

import math as m

sum = 0
for item in by_year_nat_sz['Japan']:
    if not m.isnan(item):
        print(item)
        sum += item
print('sum:',sum)
1.0
1.0
1.0
1.0
1.0
1.0
1.0
1.0
1.0
1.0
2.0
2.0
1.0
1.0
2.0
sum: 18.0
米国を除いた他の国の推移
#第二次世界大戦終結は1945年
new_index = pd.Index(np.arange(1901,2015),name='year')
by_year_nat_sz = df.groupby(['year','country']).size().unstack().reindex(new_index)

not_US = by_year_nat_sz.columns.tolist()
print(type(not_US))
not_US.remove('United States')
by_year_nat_sz['Not_US'] = by_year_nat_sz[not_US].sum(axis=1)
ax = by_year_nat_sz[['United States','Not_US']].fillna(0).cumsum().plot(figsize=(16,4))
<class 'list'>

png

地域差の詳細
by_year_nat_sz = df.groupby(['year','country']).size().unstack().reindex(new_index).fillna(0)
regions = [
    {'label':'N.America','countries':['United States','Canada']},
    {'label':'Europe','countries':['United Kingdom','Germany','France']},
    {'label':'Asia','countries':['Japan','Russia','India']}    #Russia=ロシアだがアジアにいれていいの?、India=インドもアジアなの
]                                                              #WikiによるとOKらしいユーラシヤ大陸のヨーロッパ以外のすべての国を言うらしい
for region in regions:
    by_year_nat_sz[region['label']] = by_year_nat_sz[region['countries']].sum(axis=1)
by_year_nat_sz[[r['label'] for r in regions]].cumsum().plot()
<matplotlib.axes._subplots.AxesSubplot at 0x7efce453e940>

png

受賞数上位16カ国(米国除く)の詳細
#page266の上から9行目by_nat.index(1:17]となっているがby_nat_szでは)
COL_NUM = 4
ROW_NUM = 4
by_nat_sz = df.groupby('country').size()
by_nat_sz.sort_values(ascending=False,inplace=True)
fig, axes = plt.subplots(COL_NUM,ROW_NUM,sharex=True,sharey=True,figsize=(12,12))
for i,nat in enumerate(by_nat_sz.index[1:17]):
    ax = axes[i//COL_NUM,i%COL_NUM]
    by_year_nat_sz[nat].cumsum().plot(ax=ax)
    ax.set_title(nat)

png

ヒートマップ

import seaborn as sns

bins = np.arange(df.year.min(),df.year.max(),10)
by_year_nat_binned = df.groupby([pd.cut(df.year,bins,precision=0),'country']).size().unstack().fillna(0)
plt.figure(figsize=(16,16))
sns.heatmap(by_year_nat_binned[by_year_nat_binned.sum(axis=1) > 2])
<matplotlib.axes._subplots.AxesSubplot at 0x7efcdebe5048>

png

「PythonとJavaScriptではじめるデータビジュアライゼーション」を読む

10.2 対話型セッションの開始

p224ページのipython [notebook | qt]とあるが
ipython qtではエラーがでる。
多分ipython qtconsoleまたはjupyter qtconsole

%matplotlib inline
import pandas as pd
import numpy as np
import matplotlib.pyplot as plt
import matplotlib
import json

10.3 pyplotのグローバル状態を使った対話型プロット

period_rangeメソッドの挙動

#periods引数は期間数のようである
#頻度はM,d,hが指定できるようである、yはエラーがでる
#x = pd.period_range('2017-10-01',periods=7,freq='y')
#print(x)
x = pd.period_range('2017-10-01',periods=7,freq='M')
print(x)
x = pd.period_range('2017-10-01',periods=7,freq='d')
print(x)
x = pd.period_range('2017-10-01',periods=7,freq='h')
print(x)
#to_timestampメソッドは期間の開始をタイムスタンプに変換する
print(x.to_timestamp())
#to_pydatetimeメソッドはDatetimeIndexをdatetime.datetimeオブジェクト(numpyのdarray)に変換する
print(x.to_timestamp().to_pydatetime())
print(type(x.to_timestamp().to_pydatetime()))
PeriodIndex(['2017-10', '2017-11', '2017-12', '2018-01', '2018-02', '2018-03',
             '2018-04'],
            dtype='period[M]', freq='M')
PeriodIndex(['2017-10-01', '2017-10-02', '2017-10-03', '2017-10-04',
             '2017-10-05', '2017-10-06', '2017-10-07'],
            dtype='period[D]', freq='D')
PeriodIndex(['2017-10-01 00:00', '2017-10-01 01:00', '2017-10-01 02:00',
             '2017-10-01 03:00', '2017-10-01 04:00', '2017-10-01 05:00',
             '2017-10-01 06:00'],
            dtype='period[H]', freq='H')
DatetimeIndex(['2017-10-01 00:00:00', '2017-10-01 01:00:00',
               '2017-10-01 02:00:00', '2017-10-01 03:00:00',
               '2017-10-01 04:00:00', '2017-10-01 05:00:00',
               '2017-10-01 06:00:00'],
              dtype='datetime64[ns]', freq='H')
[datetime.datetime(2017, 10, 1, 0, 0) datetime.datetime(2017, 10, 1, 1, 0)
 datetime.datetime(2017, 10, 1, 2, 0) datetime.datetime(2017, 10, 1, 3, 0)
 datetime.datetime(2017, 10, 1, 4, 0) datetime.datetime(2017, 10, 1, 5, 0)
 datetime.datetime(2017, 10, 1, 6, 0)]
<class 'numpy.ndarray'>
np.random.seed(9989) # we want to generate the same 'random' line sets
x = pd.period_range(pd.datetime.now(),
periods=200, freq='d')
x = x.to_timestamp().to_pydatetime()
#cumsumは累積和
y = np.random.randn(200,3).cumsum(0)
#p225の下から10行目に「200のタイムスロットをもつy軸とx軸を補う...」とあるがx軸とy軸がテレコでは?
#また次の行に(line)plotメソッドとあるがplt.plotメソッドでは?
plots = plt.plot(x, y)

f:id:bitop:20171001095340p:plain

10.3.1 Matplotlibの設定

http://bit.ly/1ZWSMKA (http://matplotlib.org/1.2.1/api/matplotlib_configuration_api.html)
http://bit.ly/1UTaxJ1 (http://matplotlib.org/1.4.0/users/customizing.html#the-matplotlibrc-file)

import matplotlib as mpl
mpl.rcParams['lines.linewidth'] = 2

mpl.rcParams['lines.color'] = 'r'
10.3.4 ラベルと凡例
10.3.5 タイトルと軸ラベル
#凡例の位置は色々設定できる
#'best','upper right','upper left','lower left','lower right','right',
#'center left','center right','lower center','upper center','center'    
plots = plt.plot(x, y, label='')
plt.gcf().set_size_inches(8, 4)
#propはfontのプラパティを設定している
plt.legend(plots, ('foo', 'bar', 'baz'), loc='best', framealpha=0.25,
prop={'size':'small', 'family':'monospace'})
plt.title('Random trends')
plt.xlabel('Date')
plt.ylabel('Cum. sum')
plt.grid(True)
plt.figtext(0.995, 0.01, u'© Acme Designs 2015',
ha='right', va='bottom')
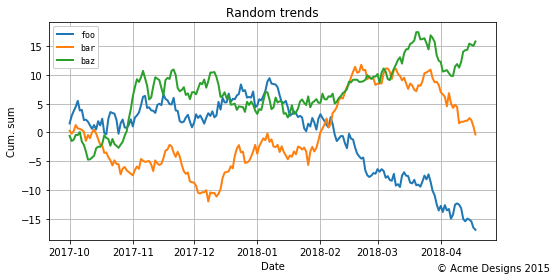
f:id:bitop:20171001095512p:plain

def generate_random_data(seed=9989):
    np.random.seed(9989)
    x = pd.period_range(pd.datetime.now(), periods=200, freq='d')
    x = x.to_timestamp().to_pydatetime()
    y = np.random.randn(200,3).cumsum(0)
    return x,y
10.4.1 軸とサブプロット
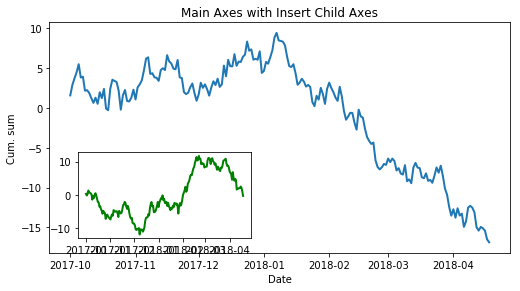
fig = plt.figure(figsize=(8,4))
#--- Main Axes
#fig.add_axesメソッド
#FigureインスタンスにAxesインスタンスを追加する
# Figureの座標は
# (0,1)------------------(1,1)
# |                          |
# |                          |
# |                          |
# |                          |
# (0,0)------------------ (1,0) 
# となっている
# add_axes引数の第一、第二引数はAxes座標の左下隅のx、y座標をFigureの座標で指定
# 第三、第四引数はAxesの幅と高さでFigureの座標の比率(0.8は80%という意味)

ax = fig.add_axes((0.1,0.1,0.8,0.8))
ax.set_title('Main Axes with Insert Child Axes')
#yには200行3列のランダムな数が入っている
ax.plot(x, y[:,0])
ax.set_xlabel('Date')
ax.set_ylabel('Cum. sum')
#--- Inserted Axes
ax = fig.add_axes([0.15,0.15,0.3,0.3])
ax.plot(x, y[:,1], color='g')
#目盛りを省略させている
ax.set_xticks([]);

f:id:bitop:20171001095552p:plain

fig, axes = plt.subplots(nrows=3,
ncols=1, sharex=True, sharey=True, figsize=(8,8))
labelled_data = zip(y.transpose(), ('foo', 'bar', 'baz'), ('b', 'g', 'r'))
fig.suptitle('Three Random Trends', fontsize=16)
for i, ld in enumerate(labelled_data):
    ax = axes[i]
    ax.plot(x, ld[0], label=ld[1], color=ld[2])
    ax.set_ylabel('Cum. sum')
    ax.legend(loc='upper left', framealpha=0.5, prop={'size':'small'})
axes[-1].set_xlabel('Date')
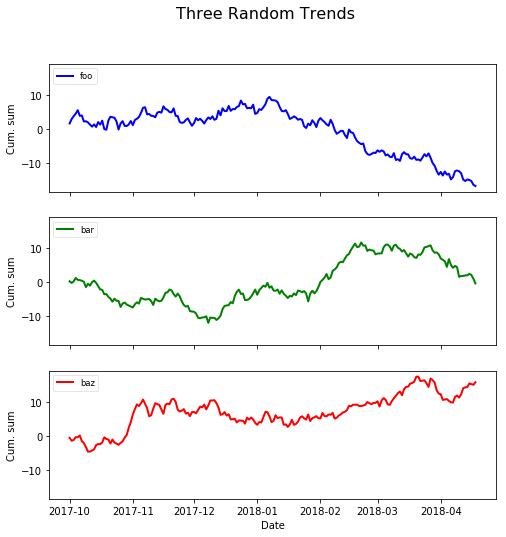
f:id:bitop:20171001095611p:plain

10.5 プロットの種類

labels = ["Physics", "Chemistry", "Literature", "Peace"]
data =   [3, 6, 10, 4]

xlocations = np.array(range(len(data)))+0.5 #[0.5,1.5,2.5,3.5]ができる,この座標は棒グラフの中心を指定している
bar_width = 0.5
plt.bar(xlocations, data, width=bar_width)
plt.yticks(range(0, 12))
plt.xticks(xlocations + bar_width/2*0, labels) #+bar_width/2分右によるとラベルが棒グラフの右端に来てしまうのでオミット
plt.xlim(0, xlocations[-1]+bar_width*1) #bar_width*2だと右領域が広すぎてしまうので1にした
plt.title("Prizes won by Fooland")
plt.gca().get_xaxis().tick_bottom()
plt.gca().get_yaxis().tick_left()
plt.gcf().set_size_inches((8,4))
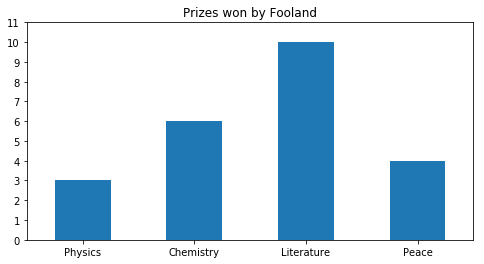
f:id:bitop:20171001095635p:plain

labels = ["Physics", "Chemistry", "Literature", "Peace"]
foo_data =   [3, 6, 10, 4]
bar_data = [8, 3, 6, 1]

fig, ax = plt.subplots(figsize=(8, 4))
width = 0.4 # bar width
xlocs = np.arange(len(foo_data))
ax.bar(xlocs-width, foo_data, width, color='#fde0bc', label='Fooland')
ax.bar(xlocs, bar_data, width, color='peru', label='Barland')
# --- labels, grids and title, then save
ax.set_yticks(range(12))
ax.set_xticks(ticks=range(len(foo_data)))
ax.set_xticklabels(labels)
ax.yaxis.grid(True)
ax.legend(loc='best')
ax.set_ylabel('Number of prizes')
fig.suptitle('Prizes by country')
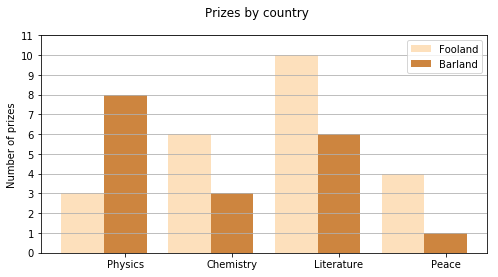
f:id:bitop:20171001095700p:plain

labels = ["Physics", "Chemistry", "Literature", "Peace"]
foo_data =   [3, 6, 10, 4]
bar_data = [8, 3, 6, 1]

fig, ax = plt.subplots(figsize=(8, 4))
width = 0.4 # bar width
ylocs = np.arange(len(foo_data))
ax.barh(ylocs-width, foo_data, width, color='#fde0bc', label='Fooland')
ax.barh(ylocs, bar_data, width, color='peru', label='Barland')
# --- labels, grids and title, then save
ax.set_xticks(range(12))
ax.set_yticks(ticks=range(len(foo_data)))
ax.set_yticklabels(labels)
ax.xaxis.grid(True)
ax.legend(loc='best')
ax.set_xlabel('Number of prizes')
fig.suptitle('Prizes by country')
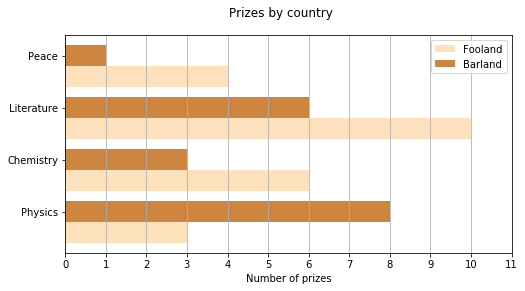
f:id:bitop:20171001095719p:plain

labels = ["Physics", "Chemistry", "Literature", "Peace"]
foo_data =   [3, 6, 10, 4]
bar_data = [8, 3, 6, 1]

fig, ax = plt.subplots(figsize=(8, 4))
width = 0.8 # bar width
xlocs = np.arange(len(foo_data))+width/2 #左端のグラフが潰れてしまうのでオフセットした
ax.bar(xlocs, foo_data, width, color='#fde0bc', label='Fooland')
ax.bar(xlocs, bar_data, width, color='peru', label='Barland', bottom=foo_data)
# --- labels, grids and title, then save
ax.set_yticks(range(18))
ax.set_xticks(ticks=np.array(range(len(foo_data))) + width/2)
ax.set_xticklabels(labels)
ax.set_xlim(-(1-width), xlocs[-1]+1)
ax.yaxis.grid(True)
ax.legend(loc='best')
ax.set_ylabel('Number of prizes')
fig.suptitle('Prizes by country')

f:id:bitop:20171001095744p:plain

10.5.2 散布図
np.random.seed(9989)
num_points = 100
gradient = 0.5
x = np.array(range(num_points))
#np.random.randnは標準分布に従った乱数を生成
y = np.random.randn(num_points) * 10 + x*gradient
fig, ax = plt.subplots(figsize=(8, 4))
ax.scatter(x, y)

fig.suptitle('A Simple Scatterplot')
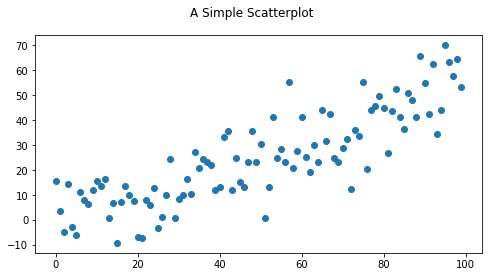
f:id:bitop:20171001095911p:plain

np.random.seed(9989)
num_points = 100
gradient = 0.5
x = np.array(range(num_points))
y = np.random.randn(num_points) * 10 + x*gradient
fig, ax = plt.subplots(figsize=(8, 4))
colors = np.random.rand(num_points)
size = np.pi * (2 + np.random.rand(num_points) * 8) ** 2
ax.scatter(x, y, s=size, c=colors, alpha=0.5)

fig.suptitle('A Simple Scatterplot')
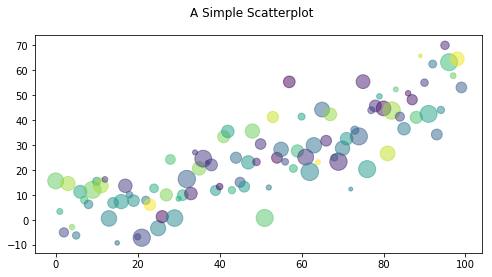
f:id:bitop:20171001095932p:plain

np.random.seed(9989)
num_points = 100
gradient = 0.5
x = np.array(range(num_points))
y = np.random.randn(num_points) * 10 + x*gradient
fig, ax = plt.subplots(figsize=(8, 4))
ax.scatter(x, y)
#1次式、2次式、多項式の最小二乗法を解いてくれる、すぐれもの
#データ(x、y)から直線y=a*x+bの傾きa、切片bを算定する
#第三引数の1は1次式という意味
m, c = np.polyfit(x, y ,1)
#2次式でも解いてみてプロット
#ここを参照
#http://ailaby.com/least_square/
m2,m1,c1 = np.polyfit(x, y ,2)
ax.plot(x, m*x + c)
ax.plot(x, m2*x**2 + m1*x + c1)
fig.suptitle('Scatterplot With Regression-line')
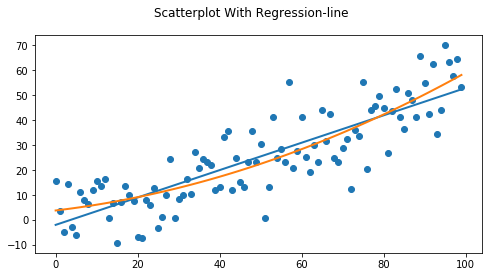
f:id:bitop:20171001095953p:plain

10.6 Seaborn

import seaborn as sns
data = pd.DataFrame({'dummy x':x, 'dummy y':y})
data.head()
dummy x dummy y
0 0 15.647707
1 1 3.365661
2 2 -5.027476
3 3 14.574908
4 4 -2.916389
sns.lmplot('dummy x', 'dummy y', data, size=4, aspect=2)

f:id:bitop:20171001100023p:plain

sns.lmplot('dummy x', 'dummy y', data, size=4, aspect=2,
scatter_kws={"color": "slategray"},
           line_kws={"linewidth": 2, "linestyle":'--', "color": "seagreen"},           
           markers='D', ci=68
           )

f:id:bitop:20171001100049p:plain

10.6.1 FaceGrid
#https://github.com/mwaskom/seaborn-data

tips = sns.load_dataset('tips')
tips.head()
total_bill tip sex smoker day time size
0 16.99 1.01 Female No Sun Dinner 2
1 10.34 1.66 Male No Sun Dinner 3
2 21.01 3.50 Male No Sun Dinner 3
3 23.68 3.31 Male No Sun Dinner 2
4 24.59 3.61 Female No Sun Dinner 4
g = sns.FacetGrid(tips, col="smoker", size=4, aspect=1)
g.map(plt.scatter, "total_bill", "tip")

f:id:bitop:20171001100110p:plain

pal = dict(Female='red', Male='blue')
g = sns.FacetGrid(tips, col="smoker", hue="sex", palette=pal, size=4, aspect=1, hue_kws={"marker": ["D", "s"]})
g.map(plt.scatter, "total_bill", "tip", alpha=.4)
g.add_legend();
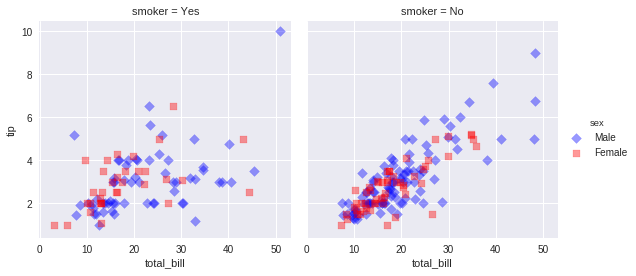
f:id:bitop:20171001100129p:plain

10.6.2 PairGrid
pal = dict(Female='red', Male='blue')
g = sns.FacetGrid(tips, col="smoker", row="time", hue="sex", palette=pal, size=4, aspect=1, hue_kws={"marker": ["D", "s"]})
g.map(sns.regplot, "total_bill", "tip")
g.add_legend();

f:id:bitop:20171001100147p:plain

pal = dict(Female='red', Male='blue')

sns.lmplot(x="total_bill", y="tip", hue="sex",size=4, aspect=1, markers=["D", "s"],
           col="smoker", row="time", data=tips, palette=pal           
           );
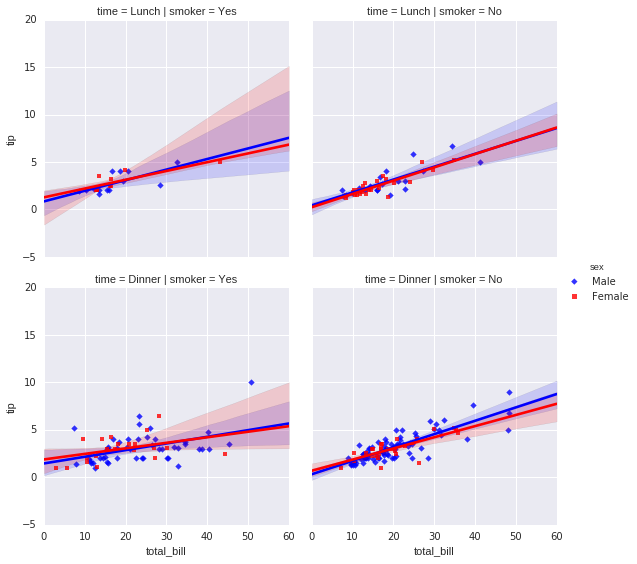
f:id:bitop:20171001100206p:plain

#あやめのデータ・セット
iris = sns.load_dataset('iris')
iris.head()
sepal_length sepal_width petal_length petal_width species
0 5.1 3.5 1.4 0.2 setosa
1 4.9 3.0 1.4 0.2 setosa
2 4.7 3.2 1.3 0.2 setosa
3 4.6 3.1 1.5 0.2 setosa
4 5.0 3.6 1.4 0.2 setosa
sns.set(font_scale=1.5)
g = sns.PairGrid(iris, hue="species")#, size=6, aspect=1)
g.map_diag(plt.hist)
g.map_offdiag(plt.scatter)
g.add_legend();
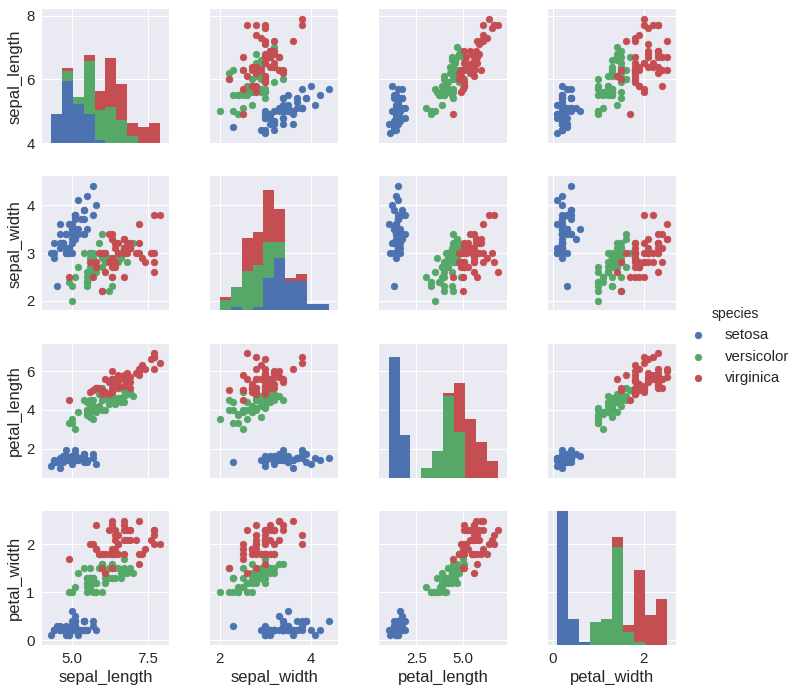
f:id:bitop:20171001100225p:plain

「PythonとJavaScriptではじめるデータビジュアライゼーション」を読む

9.4 データのクリーニング

df.born_in.describe()
count     1052
unique      40
top           
freq       910
Name: born_in, dtype: object
9.4.1 混合した型の検出
#applyはseriesのメソッドでseriesの要素にtype関数を適用させている
set(df.born_in.apply(type))
{str}
9.4.2 文字列の置換
bi_col.replace('', np.nan, inplace=True)
bi_col
0                          NaN
1       Bosnia and Herzegovina
2       Bosnia and Herzegovina
3                          NaN
4                          NaN
5                          NaN
6                          NaN
7                          NaN
8                          NaN
9                          NaN
10                         NaN
11                         NaN
12                         NaN
13                         NaN
14                     Belarus
15                     Belarus
16                     Belarus
17                         NaN
18                         NaN
19                         NaN
20                         NaN
21                         NaN
22                         NaN
23                         NaN
24                         NaN
25                         NaN
26                         NaN
27              Czech Republic
28              Czech Republic
29              Czech Republic
                 ...          
1022                       NaN
1023                   Austria
1024                   Austria
1025                       NaN
1026                       NaN
1027                   Austria
1028                       NaN
1029                       NaN
1030                   Austria
1031                   Austria
1032                       NaN
1033                       NaN
1034                   Austria
1035                 Australia
1036                       NaN
1037                       NaN
1038                       NaN
1039                 Australia
1040                       NaN
1041                 Australia
1042                       NaN
1043                       NaN
1044                       NaN
1045                       NaN
1046                 Australia
1047                       NaN
1048                       NaN
1049                       NaN
1050                       NaN
1051                       NaN
Name: born_in, Length: 1052, dtype: object
bi_col.count()
142
df.replace('', np.nan, inplace=True)
df.head()
name born_in category country date_of_birth date_of_death gender link place_of_birth place_of_death text year
0 César Milstein NaN Physiology or Medicine Argentina 8 October 1927 24 March 2002 male http://en.wikipedia.org/wiki/C%C3%A9sar_Milstein Bahía Blanca , Argentina Cambridge , England César Milstein , Physiology or Medicine, 1984 1984
1 Ivo Andric * Bosnia and Herzegovina Literature NaN 9 October 1892 13 March 1975 male http://en.wikipedia.org/wiki/Ivo_Andric Dolac (village near Travnik), Austria-Hungary ... Belgrade, SR Serbia, SFR Yugoslavia (present-d... Ivo Andric *, born in then Austria–Hungary ,... 1961
2 Vladimir Prelog * Bosnia and Herzegovina Chemistry NaN July 23, 1906 1998-01-07 male http://en.wikipedia.org/wiki/Vladimir_Prelog Sarajevo , Bosnia and Herzegovina , then part... Zürich , Switzerland Vladimir Prelog *, born in then Austria–Hung... 1975
3 Institut de Droit International NaN Peace Belgium None None None http://en.wikipedia.org/wiki/Institut_de_Droit... None None Institut de Droit International , Peace, 1904 1904
4 Auguste Beernaert NaN Peace Belgium 26 July 1829 6 October 1912 male http://en.wikipedia.org/wiki/Auguste_Marie_Fra... Ostend , Netherlands (now Belgium ) Lucerne , Switzerland Auguste Beernaert , Peace, 1909 1909
#contains関数は指定した文字列があればTrueなければFalseを返す
dfa = df[df.name.str.contains('\*')]['name']
print(dfa)
1                        Ivo Andric *
2                   Vladimir Prelog *
14                    Simon Kuznets *
15                   Menachem Begin *
16                     Shimon Peres *
27               Bertha von Suttner *
28                       Gerty Cori *
29              Carl Ferdinand Cori *
50                  Henry Kissinger *
51                     Arno Penzias *
53              Georges J.F. Köhler *
58                 Jack Steinberger *
63                  Hans G. Dehmelt *
82                  Renato Dulbecco *
87                Riccardo Giacconi *
88                   Mario Capecchi *
101     Mario José Molina Henríquez *
102                Gabriel Lippmann *
103               Jules A. Hoffmann *
104                  Andrew Schally *
105                  Czesław Miłosz *
106                      Aaron Klug *
109                 Wilhelm Ostwald *
115                    Severo Ochoa *
120                Allan M. Cormack *
126                  Sydney Brenner *
128                  Michael Levitt *
135                 Niels Kaj Jerne *
138                   Michael Smith *
268                     T. S. Eliot *
                    ...              
935            Luis Federico Leloir *
937                   Seán MacBride *
938                 Roger Guillemin *
962             Niels Ryberg Finsen *
972                 Leopold Ružička *
978                  Daniel C. Tsui *
979                    Gao Xingjian *
980                  Charles K. Kao *
987                 William Giauque *
989              Charles B. Huggins *
991                     Saul Bellow *
992                  David H. Hubel *
993                     Henry Taube *
997               Rudolph A. Marcus *
1001                William Vickrey *
1002                  Myron Scholes *
1005               Willard S. Boyle *
1008                  Elias Canetti *
1009                  Peter Medawar *
1010       Zhores Ivanovich Alferov *
1023                     Otto Loewi *
1024                   Richard Kuhn *
1027                Karl von Frisch *
1030                    Walter Kohn *
1031                 Eric R. Kandel *
1034                 Martin Karplus *
1035         William Lawrence Bragg *
1039         Aleksandr M. Prokhorov *
1041          John Warcup Cornforth *
1046         Elizabeth H. Blackburn *
Name: name, Length: 142, dtype: object
df.name = df.name.str.replace('*', '')
df.name = df.name.str.strip()
df[df.name.str.contains('\*')]
name born_in category country date_of_birth date_of_death gender link place_of_birth place_of_death text year
9.4.3 行の削除
np.nan == np.nan
False
df = df[df.born_in.isnull()]
df.count()
name              910
born_in             0
category          909
country           910
date_of_birth     901
date_of_death     589
gender            900
link              910
place_of_birth    875
place_of_death    546
text              910
year              910
dtype: int64
df = df.drop('born_in', axis=1)
df.head()
name category country date_of_birth date_of_death gender link place_of_birth place_of_death text year
0 César Milstein Physiology or Medicine Argentina 8 October 1927 24 March 2002 male http://en.wikipedia.org/wiki/C%C3%A9sar_Milstein Bahía Blanca , Argentina Cambridge , England César Milstein , Physiology or Medicine, 1984 1984
3 Institut de Droit International Peace Belgium None None None http://en.wikipedia.org/wiki/Institut_de_Droit... None None Institut de Droit International , Peace, 1904 1904
4 Auguste Beernaert Peace Belgium 26 July 1829 6 October 1912 male http://en.wikipedia.org/wiki/Auguste_Marie_Fra... Ostend , Netherlands (now Belgium ) Lucerne , Switzerland Auguste Beernaert , Peace, 1909 1909
5 Maurice Maeterlinck Literature Belgium 29 August 1862 6 May 1949 male http://en.wikipedia.org/wiki/Maurice_Maeterlinck Ghent , Belgium Nice , France Maurice Maeterlinck , Literature, 1911 1911
6 Henri La Fontaine Peace Belgium 22 April 1854 14 May 1943 male http://en.wikipedia.org/wiki/Henri_La_Fontaine Brussels Belgium Henri La Fontaine , Peace, 1913 1913
9.4.4 重複の検出
#duplicated関数は名前列で重複する行(一致する行)をみつけるとTrueを返す。そうでなければFalse
dupes_by_name = df[df.duplicated('name')]
dupes_by_name.count()
name              46
category          46
country           46
date_of_birth     45
date_of_death     24
gender            44
link              46
place_of_birth    45
place_of_death    23
text              46
year              46
dtype: int64

duplicated関数の挙動 通常のduplicated関数とkeepに'lastオプションをつけたものを|で結合すると
全く重複していないデータ以外全てTrueになる。
(ここではindex3の'&&&'が唯一重複を持たないデータ)

dfa = pd.DataFrame({'name':['###','***','$$$','%%%','&&&','###','%%%','$$$','###','$$$','***','%%%']})
print(dfa)
first_dupes = dfa.duplicated('name')
print(first_dupes)
last_dupes = dfa.duplicated('name',keep='last')
print(last_dupes)
dfa[dfa.duplicated('name') | dfa.duplicated('name',keep='last')]
   name
0   ###
1   ***
2   $$$
3   %%%
4   &&&
5   ###
6   %%%
7   $$$
8   ###
9   $$$
10  ***
11  %%%
0     False
1     False
2     False
3     False
4     False
5      True
6      True
7      True
8      True
9      True
10     True
11     True
dtype: bool
0      True
1      True
2      True
3      True
4     False
5      True
6      True
7      True
8     False
9     False
10    False
11    False
dtype: bool
name
0 ###
1 ***
2 $$$
3 %%%
5 ###
6 %%%
7 $$$
8 ###
9 $$$
10 ***
11 %%%
all_dupes = df[df.duplicated('name')\
| df.duplicated('name', keep='last')]
all_dupes.count()
name              92
category          92
country           92
date_of_birth     90
date_of_death     48
gender            88
link              92
place_of_birth    90
place_of_death    46
text              92
year              92
dtype: int64
all_dupes = df[df.name.isin(dupes_by_name.name)]
all_dupes.count()
name              92
category          92
country           92
date_of_birth     90
date_of_death     48
gender            88
link              92
place_of_birth    90
place_of_death    46
text              92
year              92
dtype: int64
pd.concat([g for _,g in df.groupby('name')\
if len(g) > 1])['name']
121                   Aaron Klug
131                   Aaron Klug
615              Albert Einstein
844              Albert Einstein
176                Arieh Warshel
798                Arieh Warshel
94                 Avram Hershko
830                Avram Hershko
228             Baruj Benacerraf
366             Baruj Benacerraf
573               Betty Williams
805               Betty Williams
162             Brian P. Schmidt
1047            Brian P. Schmidt
498               Charles K. Kao
831               Charles K. Kao
295               Chen Ning Yang
976               Chen Ning Yang
0                 César Milstein
134               César Milstein
623                 Daniel Bovet
790                 Daniel Bovet
93               Daniel Kahneman
457              Daniel Kahneman
407            Edmond H. Fischer
630            Edmond H. Fischer
505              Ei-ichi Negishi
778              Ei-ichi Negishi
524            Ernest Rutherford
985            Ernest Rutherford
                  ...           
632     Médecins Sans Frontières
947     Médecins Sans Frontières
490              Osamu Shimomura
776              Osamu Shimomura
72                Philipp Lenard
1013              Philipp Lenard
650                Ragnar Granit
960                Ragnar Granit
510            Ralph M. Steinman
1006           Ralph M. Steinman
85          Rita Levi-Montalcini
376         Rita Levi-Montalcini
96                 Robert Aumann
476                Robert Aumann
137                 Ronald Coase
405                 Ronald Coase
515               Shuji Nakamura
780               Shuji Nakamura
396                Sidney Altman
995                Sidney Altman
451               Sydney Brenner
586               Sydney Brenner
172             Thomas C. Südhof
905             Thomas C. Südhof
294                Tsung-Dao Lee
975                Tsung-Dao Lee
333             Wassily Leontief
684             Wassily Leontief
489               Yoichiro Nambu
773               Yoichiro Nambu
Name: name, Length: 92, dtype: object
9.4.5 データのソート
df2 = pd.DataFrame(\
{'name':['zak', 'alice', 'bob', 'mike', 'bob', 'bob'],\
'score':[4, 3, 5, 2, 3, 7]})
df2.sort_values(['name', 'score'],\
ascending=[1,0])
name score
1 alice 3
5 bob 7
2 bob 5
4 bob 3
3 mike 2
0 zak 4
all_dupes.sort_values('name')[['name', 'country', 'year']]
name country year
121 Aaron Klug South Africa 1982
131 Aaron Klug United Kingdom 1982
844 Albert Einstein Germany 1921
615 Albert Einstein Switzerland 1921
176 Arieh Warshel United States 2013
798 Arieh Warshel Israel 2013
830 Avram Hershko Hungary 2004
94 Avram Hershko Israel 2004
366 Baruj Benacerraf United States 1980
228 Baruj Benacerraf Venezuela 1980
805 Betty Williams Ireland 1976
573 Betty Williams United Kingdom 1976
162 Brian P. Schmidt United States 2011
1047 Brian P. Schmidt Australia 2011
498 Charles K. Kao United States 2009
831 Charles K. Kao Hong Kong 2009
976 Chen Ning Yang China 1957
295 Chen Ning Yang United States 1957
0 César Milstein Argentina 1984
134 César Milstein United Kingdom 1984
623 Daniel Bovet Switzerland 1957
790 Daniel Bovet Italy 1957
93 Daniel Kahneman Israel 2002
457 Daniel Kahneman United States 2002
630 Edmond H. Fischer Switzerland 1992
407 Edmond H. Fischer United States 1992
778 Ei-ichi Negishi Japan 2010
505 Ei-ichi Negishi United States 2010
985 Ernest Rutherford Canada 1908
524 Ernest Rutherford United Kingdom 1908
... ... ... ...
947 Médecins Sans Frontières France 1999
632 Médecins Sans Frontières Switzerland 1999
776 Osamu Shimomura Japan 2008
490 Osamu Shimomura United States 2008
1013 Philipp Lenard Austria 1905
72 Philipp Lenard Germany 1905
650 Ragnar Granit Sweden 1967
960 Ragnar Granit Finland 1809
1006 Ralph M. Steinman Canada 2011
510 Ralph M. Steinman United States 2011
85 Rita Levi-Montalcini Italy 1986
376 Rita Levi-Montalcini United States 1986
96 Robert Aumann Israel 2005
476 Robert Aumann United States 2005
405 Ronald Coase United States 1991
137 Ronald Coase United Kingdom 1991
515 Shuji Nakamura United States 2014
780 Shuji Nakamura Japan 2014
995 Sidney Altman Canada 1989
396 Sidney Altman United States 1990
451 Sydney Brenner United States 2002
586 Sydney Brenner United Kingdom 2002
905 Thomas C. Südhof Germany 2013
172 Thomas C. Südhof United States 2013
975 Tsung-Dao Lee China 1957
294 Tsung-Dao Lee United States 1957
333 Wassily Leontief United States 1973
684 Wassily Leontief Russia 1973
773 Yoichiro Nambu Japan 2008
489 Yoichiro Nambu United States 2008

92 rows × 3 columns

9.4.6重複の削除
df.loc[(df.name == u'Marie Sk\u0142odowska-Curie') &\
(df.year == 1911), 'country'] = 'France'
df.drop(df[(df.name == 'Sidney Altman') &\
(df.year == 1990)].index,
inplace=True)
def clean_data(df):
    df = df.replace('', np.nan)
    df = df[df.born_in.isnull()]
    df = df.drop('born_in', axis=1)
    df.drop(df[df.year == 1809].index, inplace=True)
    df = df[~(df.name == 'Marie Curie')]
    df.loc[(df.name == u'Marie Sk\u0142odowska-Curie') &\
    (df.year == 1911), 'country'] = 'France'
    df = df[~((df.name == 'Sidney Altman') &\
    (df.year == 1990))]
    return df
# Apply our clean_data function to the reloaded dirty data
df = reload_data()
df = clean_data(df)
df = df.reindex(np.random.permutation(df.index))
df = df.drop_duplicates(['name', 'year'])
df = df.sort_index()
df.count()
category          864
country           865
date_of_birth     857
date_of_death     566
gender            857
link              865
name              865
place_of_birth    831
place_of_death    524
text              865
year              865
dtype: int64
df[df.duplicated('name') |
df.duplicated('name', keep='last')]\
.sort_values(by='name')\
[['name', 'country', 'year', 'category']]
name country year category
548 Frederick Sanger United Kingdom 1958 Chemistry
580 Frederick Sanger United Kingdom 1980 Chemistry
292 John Bardeen United States 1956 Physics
326 John Bardeen United States 1972 Physics
285 Linus C. Pauling United States 1954 Chemistry
309 Linus C. Pauling United States 1962 Peace
706 Marie Skłodowska-Curie Poland 1903 Physics
709 Marie Skłodowska-Curie France 1911 Chemistry
9.4.7 欠損フィールドの処理
df.count()
category          864
country           865
date_of_birth     857
date_of_death     566
gender            857
link              865
name              865
place_of_birth    831
place_of_death    524
text              865
year              865
dtype: int64
df[df.category.isnull()][['name', 'text']]
name text
922 Alexis Carrel Alexis Carrel , Medicine, 1912
df.ix[df.name == 'Alexis Carrel', 'category'] =\
'Physiology or Medicine'
/home/beetle/anaconda3/lib/python3.6/site-packages/ipykernel_launcher.py:1: DeprecationWarning: 
.ix is deprecated. Please use
.loc for label based indexing or
.iloc for positional indexing

See the documentation here:
http://pandas.pydata.org/pandas-docs/stable/indexing.html#deprecate_ix
  """Entry point for launching an IPython kernel.
df[df.gender.isnull()]['name']
3                         Institut de Droit International
156                               Friends Service Council
267     American Friends Service Committee  (The Quakers)
574                                 Amnesty International
650                                         Ragnar Granit
947                              Médecins Sans Frontières
1000     Pugwash Conferences on Science and World Affairs
1033                   International Atomic Energy Agency
Name: name, dtype: object
df = df[df.gender.notnull()]
df.ix[df.name == 'Ragnar Granit', 'gender'] = 'male'
/home/beetle/anaconda3/lib/python3.6/site-packages/ipykernel_launcher.py:2: DeprecationWarning: 
.ix is deprecated. Please use
.loc for label based indexing or
.iloc for positional indexing

See the documentation here:
http://pandas.pydata.org/pandas-docs/stable/indexing.html#deprecate_ix
df[df.date_of_birth.isnull()]['name']
782    Hiroshi Amano
Name: name, dtype: object
df.ix[df.name == 'Hiroshi Amano', 'date_of_birth'] =\
'11 September 1960'
# Note that the example in the book uses the original DataFrame, not our newly cleaned one, used here
# Row 2 (Vladamir Prelog) is therefore missing
df[['name', 'date_of_birth']]
name date_of_birth
0 César Milstein 8 October 1927
4 Auguste Beernaert 26 July 1829
5 Maurice Maeterlinck 29 August 1862
6 Henri La Fontaine 22 April 1854
7 Jules Bordet 13 June 1870
8 Corneille Heymans 28 March 1892
9 Georges Pire 1910-02-10
10 Albert Claude 24 August 1899
11 Christian de Duve 2 October 1917
12 Ilya Prigogine 25 January 1917
13 François Englert 6 November 1932
17 Karl Adolph Gjellerup June 2, 1857
18 August Krogh November 15, 1874
19 Niels Bohr 7 October 1885
20 Johannes Andreas Grib Fibiger 23 April 1867
21 Henrik Dam 21 February 1895
22 Johannes Vilhelm Jensen 1873-01-20
23 Ben Roy Mottelson July 9, 1926
24 Aage Bohr 19 June 1922
25 Niels Kaj Jerne December 23, 1911
26 Jens Christian Skou October 8, 1918
30 Jaroslav Heyrovský December 20, 1890
31 Jaroslav Seifert 23 September 1901
32 Christopher A. Pissarides 1948-02-20
33 Irène Joliot-Curie 12 September 1897
34 Frédéric Joliot 19 March 1900
35 Roger Martin du Gard 23 March 1881
36 André Gide 1869-11-22
37 Léon Jouhaux July 1, 1879
38 Albert Schweitzer 14 January 1875
... ... ...
1011 Muhammad Yunus 28 June 1940
1012 Lev Landau January 22, 1908
1013 Philipp Lenard June 7, 1862
1014 Bertha von Suttner June 9, 1843
1015 Alfred Hermann Fried 11 November 1864
1016 Robert Bárány 22 April 1876
1017 Friderik Pregl 3 September 1869
1018 Richard Adolf Zsigmondy 1 April 1865
1019 Julius Wagner-Jauregg 7 March 1857
1020 Karl Landsteiner June 14, 1868
1021 Erwin Schrödinger 12 August 1887
1022 Victor Francis Hess 24 June 1883
1025 Wolfgang Pauli 25 April 1900
1026 Max F. Perutz 19 May 1914
1028 Konrad Lorenz November 7, 1903
1029 Friedrich Hayek 8 May 1899
1032 Elfriede Jelinek 20 October 1946
1036 Sir Howard Florey 24 September 1898
1037 Sir Frank Macfarlane Burnet 3 September 1899
1038 John Carew Eccles 27 January 1903
1040 Patrick White 28 May 1912
1042 John Harsanyi May 29, 1920
1043 Peter C. Doherty & Professor Rolf Zinkernagel 15 October 1940
1044 J. Robin Warren 11 June 1937
1045 Barry Marshall 30 September 1951
1047 Brian P. Schmidt February 24, 1967
1048 Carlos Saavedra Lamas November 1, 1878
1049 Bernardo Houssay 1887-04-10
1050 Luis Federico Leloir 1906-9-6
1051 Adolfo Pérez Esquivel November 26, 1931

857 rows × 2 columns

9.4.8 時刻と日付の処理
pd.to_datetime(df.date_of_birth, errors='raise')
0      1927-10-08
4      1829-07-26
5      1862-08-29
6      1854-04-22
7      1870-06-13
8      1892-03-28
9      1910-02-10
10     1899-08-24
11     1917-10-02
12     1917-01-25
13     1932-11-06
17     1857-06-02
18     1874-11-15
19     1885-10-07
20     1867-04-23
21     1895-02-21
22     1873-01-20
23     1926-07-09
24     1922-06-19
25     1911-12-23
26     1918-10-08
30     1890-12-20
31     1901-09-23
32     1948-02-20
33     1897-09-12
34     1900-03-19
35     1881-03-23
36     1869-11-22
37     1879-07-01
38     1875-01-14
          ...    
1011   1940-06-28
1012   1908-01-22
1013   1862-06-07
1014   1843-06-09
1015   1864-11-11
1016   1876-04-22
1017   1869-09-03
1018   1865-04-01
1019   1857-03-07
1020   1868-06-14
1021   1887-08-12
1022   1883-06-24
1025   1900-04-25
1026   1914-05-19
1028   1903-11-07
1029   1899-05-08
1032   1946-10-20
1036   1898-09-24
1037   1899-09-03
1038   1903-01-27
1040   1912-05-28
1042   1920-05-29
1043   1940-10-15
1044   1937-06-11
1045   1951-09-30
1047   1967-02-24
1048   1878-11-01
1049   1887-04-10
1050   1906-09-06
1051   1931-11-26
Name: date_of_birth, Length: 857, dtype: datetime64[ns]
#date_of_deathでは例外でた
pd.to_datetime(df.date_of_death, errors='raise')
---------------------------------------------------------------------------

TypeError                                 Traceback (most recent call last)

/home/beetle/anaconda3/lib/python3.6/site-packages/pandas/core/tools/datetimes.py in _convert_listlike(arg, box, format, name, tz)
    443             try:
--> 444                 values, tz = tslib.datetime_to_datetime64(arg)
    445                 return DatetimeIndex._simple_new(values, name=name, tz=tz)


pandas/_libs/tslib.pyx in pandas._libs.tslib.datetime_to_datetime64 (pandas/_libs/tslib.c:33275)()


TypeError: Unrecognized value type: <class 'str'>


During handling of the above exception, another exception occurred:


ValueError                                Traceback (most recent call last)

<ipython-input-56-2a87872c34e6> in <module>()
----> 1 pd.to_datetime(df.date_of_death, errors='raise')


/home/beetle/anaconda3/lib/python3.6/site-packages/pandas/core/tools/datetimes.py in to_datetime(arg, errors, dayfirst, yearfirst, utc, box, format, exact, unit, infer_datetime_format, origin)
    507     elif isinstance(arg, ABCSeries):
    508         from pandas import Series
--> 509         values = _convert_listlike(arg._values, False, format)
    510         result = Series(values, index=arg.index, name=arg.name)
    511     elif isinstance(arg, (ABCDataFrame, MutableMapping)):


/home/beetle/anaconda3/lib/python3.6/site-packages/pandas/core/tools/datetimes.py in _convert_listlike(arg, box, format, name, tz)
    445                 return DatetimeIndex._simple_new(values, name=name, tz=tz)
    446             except (ValueError, TypeError):
--> 447                 raise e
    448 
    449     if arg is None:


/home/beetle/anaconda3/lib/python3.6/site-packages/pandas/core/tools/datetimes.py in _convert_listlike(arg, box, format, name, tz)
    433                     dayfirst=dayfirst,
    434                     yearfirst=yearfirst,
--> 435                     require_iso8601=require_iso8601
    436                 )
    437 


pandas/_libs/tslib.pyx in pandas._libs.tslib.array_to_datetime (pandas/_libs/tslib.c:46617)()


pandas/_libs/tslib.pyx in pandas._libs.tslib.array_to_datetime (pandas/_libs/tslib.c:46233)()


pandas/_libs/tslib.pyx in pandas._libs.tslib.array_to_datetime (pandas/_libs/tslib.c:46122)()


pandas/_libs/tslib.pyx in pandas._libs.tslib.parse_datetime_string (pandas/_libs/tslib.c:35351)()


/home/beetle/anaconda3/lib/python3.6/site-packages/dateutil/parser.py in parse(timestr, parserinfo, **kwargs)
   1166         return parser(parserinfo).parse(timestr, **kwargs)
   1167     else:
-> 1168         return DEFAULTPARSER.parse(timestr, **kwargs)
   1169 
   1170 


/home/beetle/anaconda3/lib/python3.6/site-packages/dateutil/parser.py in parse(self, timestr, default, ignoretz, tzinfos, **kwargs)
    579                 repl['day'] = monthrange(cyear, cmonth)[1]
    580 
--> 581         ret = default.replace(**repl)
    582 
    583         if res.weekday is not None and not res.day:


ValueError: month must be in 1..12
for i,row in df.iterrows():
    try:
        pd.to_datetime(row.date_of_death,errors='raise')
    except:
        print('%s(%s, %d)'%(row.date_of_death.ljust(30),row['name'],i))
1968-23-07                    (Henry Hallett Dale, 150)
May 30, 2011 (aged 89)        (Rosalyn Yalow, 349)
living                        (David Trimble, 581)
Diederik Korteweg             (Johannes Diderik van der Waals, 746)
living                        (Shirin Ebadi, 809)
living                        (Rigoberta Menchú, 833)
1 February 1976, age 74       (Werner Karl Heisenberg, 858)
with_death_dates = df[df.date_of_death.notnull()]
bad_dates = pd.isnull(pd.to_datetime(\
with_death_dates.date_of_death, errors='coerce'))
with_death_dates[bad_dates][['category', 'date_of_death',\
'name']]
category date_of_death name
150 Physiology or Medicine 1968-23-07 Henry Hallett Dale
349 Physiology or Medicine May 30, 2011 (aged 89) Rosalyn Yalow
581 Peace living David Trimble
746 Physics Diederik Korteweg Johannes Diderik van der Waals
809 Peace living Shirin Ebadi
833 Peace living Rigoberta Menchú
858 Physics 1 February 1976, age 74 Werner Karl Heisenberg
df.date_of_death = pd.to_datetime(df.date_of_death,\
errors='coerce')
df['award_age'] = df.year - pd.DatetimeIndex(df.date_of_birth)\
.year
df.sort_values('award_age').iloc[:10]\
[['name', 'award_age', 'category', 'year']]
name award_age category year
725 Malala Yousafzai 17 Peace 2014
525 William Lawrence Bragg 25 Physics 1915
626 Georges J. F. Köhler 30 Physiology or Medicine 1976
858 Werner Karl Heisenberg 31 Physics 1932
975 Tsung-Dao Lee 31 Physics 1957
146 Paul Dirac 31 Physics 1933
247 Carl Anderson 31 Physics 1936
877 Rudolf Mössbauer 32 Physics 1961
226 Tawakkol Karman 32 Peace 2011
804 Mairéad Corrigan 32 Peace 1976

9.5 完成したclean_data関数

def clean_data(df):
    """The full clean data function, which returns both the cleaned Nobel data (df) and a DataFrame 
    containing those winners with a born_in field."""
    df = df.replace('', np.nan)
    df_born_in = df[df.born_in.notnull()] 
    df = df[df.born_in.isnull()]
    df = df.drop('born_in', axis=1) 
    df.drop(df[df.year == 1809].index, inplace=True) 
    df = df[~(df.name == 'Marie Curie')]
    df.loc[(df.name == u'Marie Sk\u0142odowska-Curie') &\
           (df.year == 1911), 'country'] = 'France'
    df = df[~((df.name == 'Sidney Altman') & (df.year == 1990))]
    df = df.reindex(np.random.permutation(df.index)) 
    df = df.drop_duplicates(['name', 'year'])         
    df = df.sort_index()
    df.ix[df.name == 'Alexis Carrel', 'category'] =\
        'Physiology or Medicine' 
    df.ix[df.name == 'Ragnar Granit', 'gender'] = 'male'
    df = df[df.gender.notnull()] # remove institutional prizes
    df.ix[df.name == 'Hiroshi Amano', 'date_of_birth'] =\
    '11 September 1960'
    df.date_of_birth = pd.to_datetime(df.date_of_birth) 
    df.date_of_death = pd.to_datetime(df.date_of_death, errors='coerce') 
    df['award_age'] = df.year - pd.DatetimeIndex(df.date_of_birth).year 
    return df, df_born_in

9.6 クリーニングしたデータ・セットの保存

省略

「PythonとJavaScriptではじめるデータビジュアライゼーション」を読む

9.3 インデックスとpandasのデータ選択

#列のカラム名
print(df.columns)
#列数
print(len(df.columns))
Index(['born_in', 'category', 'country', 'date_of_birth', 'date_of_death',
       'gender', 'link', 'name', 'place_of_birth', 'place_of_death', 'text',
       'year'],
      dtype='object')
12
#DataFrameのインデックに使う列を指定する
#インデックスを変更すると新しくDatFrameを生成して返すので
#もとのDataFrameは変更されない
#ここではもとの変数に代入しているので変更されている
df = df.set_index('name')
df.head(2)
born_in category country date_of_birth date_of_death gender link place_of_birth place_of_death text year
name
César Milstein Physiology or Medicine Argentina 8 October 1927 24 March 2002 male http://en.wikipedia.org/wiki/C%C3%A9sar_Milstein Bahía Blanca , Argentina Cambridge , England César Milstein , Physiology or Medicine, 1984 1984
Ivo Andric * Bosnia and Herzegovina Literature 9 October 1892 13 March 1975 male http://en.wikipedia.org/wiki/Ivo_Andric Dolac (village near Travnik), Austria-Hungary ... Belgrade, SR Serbia, SFR Yugoslavia (present-d... Ivo Andric *, born in then Austria–Hungary ,... 1961
#インデックスにした列が最左端にくる
#df = df.set_index('born_in')
#df.head(2)
df.reset_index(inplace=True)
df.head(2)
name born_in category country date_of_birth date_of_death gender link place_of_birth place_of_death text year
0 César Milstein Physiology or Medicine Argentina 8 October 1927 24 March 2002 male http://en.wikipedia.org/wiki/C%C3%A9sar_Milstein Bahía Blanca , Argentina Cambridge , England César Milstein , Physiology or Medicine, 1984 1984
1 Ivo Andric * Bosnia and Herzegovina Literature 9 October 1892 13 March 1975 male http://en.wikipedia.org/wiki/Ivo_Andric Dolac (village near Travnik), Austria-Hungary ... Belgrade, SR Serbia, SFR Yugoslavia (present-d... Ivo Andric *, born in then Austria–Hungary ,... 1961
bi_col = df.born_in
bi_col
0                             
1       Bosnia and Herzegovina
2       Bosnia and Herzegovina
3                             
4                             
5                             
6                             
7                             
8                             
9                             
10                            
11                            
12                            
13                            
14                     Belarus
15                     Belarus
16                     Belarus
17                            
18                            
19                            
20                            
21                            
22                            
23                            
24                            
25                            
26                            
27              Czech Republic
28              Czech Republic
29              Czech Republic
                 ...          
1022                          
1023                   Austria
1024                   Austria
1025                          
1026                          
1027                   Austria
1028                          
1029                          
1030                   Austria
1031                   Austria
1032                          
1033                          
1034                   Austria
1035                 Australia
1036                          
1037                          
1038                          
1039                 Australia
1040                          
1041                 Australia
1042                          
1043                          
1044                          
1045                          
1046                 Australia
1047                          
1048                          
1049                          
1050                          
1051                          
Name: born_in, Length: 1052, dtype: object
type(bi_col)
pandas.core.series.Series
#locはlocationの省略形で位置という意味で使われているもよう
#locはラベルによる行の指定,ilocは番号による行の指定,ixはどっちもOK
df.iloc[0]
name                                                César Milstein
born_in                                                           
category                                    Physiology or Medicine
country                                                  Argentina
date_of_birth                                       8 October 1927
date_of_death                                        24 March 2002
gender                                                        male
link              http://en.wikipedia.org/wiki/C%C3%A9sar_Milstein
place_of_birth                           Bahía Blanca ,  Argentina
place_of_death                                 Cambridge , England
text                 César Milstein , Physiology or Medicine, 1984
year                                                          1984
Name: 0, dtype: object
#2行ある受賞年が1921年なので重複した記載になる(countryがスイスとドイツ2つある)
df.set_index('name', inplace=True)
df.loc['Albert Einstein']
born_in category country date_of_birth date_of_death gender link place_of_birth place_of_death text year
name
Albert Einstein Physics Switzerland 1879-03-14 1955-04-18 male http://en.wikipedia.org/wiki/Albert_Einstein Ulm , Baden-Württemberg , German Empire Princeton, New Jersey , U.S. Albert Einstein , born in Germany , Physics, ... 1921
Albert Einstein Physics Germany 1879-03-14 1955-04-18 male http://en.wikipedia.org/wiki/Albert_Einstein Ulm , Baden-Württemberg , German Empire Princeton, New Jersey , U.S. Albert Einstein , Physics, 1921 1921
df.reset_index(inplace=True)
9.3.1 複数行の選択
mask = df.year > 2000
winners_since_2000 = df[mask]
winners_since_2000.count()
name              202
born_in           202
category          202
country           202
date_of_birth     201
date_of_death     201
gender            200
link              202
place_of_birth    201
place_of_death    201
text              202
year              202
dtype: int64
winners_since_2000.head()
name born_in category country date_of_birth date_of_death gender link place_of_birth place_of_death text year
13 François Englert Physics Belgium 6 November 1932 male http://en.wikipedia.org/wiki/Fran%C3%A7ois_Eng... Etterbeek , Brussels , Belgium François Englert , Physics, 2013 2013
32 Christopher A. Pissarides Economics Cyprus 1948-02-20 male http://en.wikipedia.org/wiki/Christopher_A._Pi... Nicosia, Cyprus Christopher A. Pissarides , Economics, 2010 2010
66 Kofi Annan Peace Ghana 8 April 1938 male http://en.wikipedia.org/wiki/Kofi_Annan Kumasi , Ghana Kofi Annan , Peace, 2001 2001
87 Riccardo Giacconi * Italy Physics October 6, 1931 male http://en.wikipedia.org/wiki/Riccardo_Giacconi Genoa , Italy Riccardo Giacconi *, Physics, 2002 2002
88 Mario Capecchi * Italy Physiology or Medicine 6 October 1937 male http://en.wikipedia.org/wiki/Mario_Capecchi Verona , Italy Mario Capecchi *, Physiology or Medicine, 2007 2007