Interface2017年05月号新画像処理101を読む

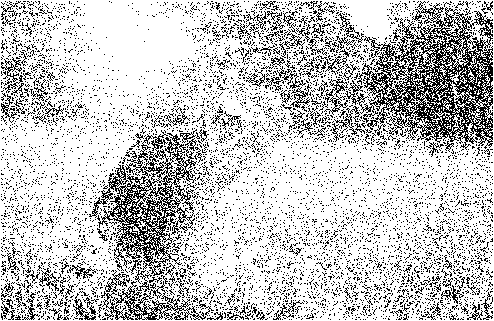
A-2 濃度パターンを用いる代表的な濃淡表現「ハーフトーン型ハーフトーニング」

from random import random
img_src = cv2.imread("data/img_A-2.bmp")
img_dst = np.empty_like(img_src)
#座標の大きさ
eight = img_src.shape[0]
width = img_src.shape[1]
patt = np.array([[10,4,6,8],
                        [12,0,2,14],
                        [7,9,11,5],
                        [3,15,13,1]])

for y in range(0,eight,4):
    for x in range(0,width,4):
        for j in range(4):
            for i in range(4):
                if img_src[y+j,x+i,0] < patt[i,j] * 16 + 8:
                    img_dst[y+j,x+i] = [0,0,0]
                else:
                    img_dst[y+j,x+i] = [255,255,255]

#描画する
cv2.imshow("img_src",img_src)
cv2.imshow("img_dst",img_dst)

cv2.waitKey(0)
cv2.destroyAllWindows()

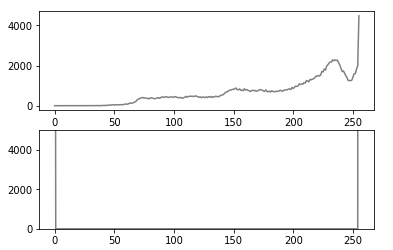
#ヒストグラム
fig = plt.figure()
ax1 = fig.add_subplot(211) #総行数,総列数、サブプロット番号
ax2 = fig.add_subplot(212)

color_list = ["gray"]
ax2.set_ylim(0,5000)
for i,j in enumerate(color_list):
    hist = cv2.calcHist([img_src],[i],None,[256],[0,256])
    ax1.plot(hist,color = j)

color_list = ["gray"]
ax2.set_ylim(0,5000)
for i,j in enumerate(color_list):
    hist = cv2.calcHist([img_dst],[i],None,[256],[0,256])
    ax2.plot(hist,color = j)

f:id:bitop:20180214060504p:plain

f:id:bitop:20180214060533p:plain

f:id:bitop:20180214060615p:plain

Interface2017年05月号新画像処理101を読む

技A 白黒の粗密濃淡表現

A-1 白黒の粗密で濃淡を表現する「ハーフトーニング」

from random import random
img_src = cv2.imread("data/img_A-1.bmp")
img_gray = cv2.cvtColor(img_src,cv2.COLOR_RGB2GRAY) 
img_dst = np.empty_like(img_src)
#座標の大きさ
eight = img_gray.shape[0]
width = img_gray.shape[1]
k = 0.1
for y in range(eight):
    for x in range(width):
        gray = img_gray[y,x]
        T = (1.0 - k) * (1.0 - gray/255.0)
        P = random()
        if P > T:
            img_dst[y,x] = [255,255,255]
        else:
            img_dst[y,x] = [0,0,0]

#描画する
cv2.imshow("img_src",img_src)
cv2.imshow("img_dst",img_dst)

cv2.waitKey(0)
cv2.destroyAllWindows()

#ヒストグラム
fig = plt.figure()
ax1 = fig.add_subplot(211) #総行数,総列数、サブプロット番号
ax2 = fig.add_subplot(212)

color_list = ["gray"]
ax2.set_ylim(0,5000)
for i,j in enumerate(color_list):
    hist = cv2.calcHist([img_src],[i],None,[256],[0,256])
    ax1.plot(hist,color = j)

color_list = ["gray"]
ax2.set_ylim(0,5000)
for i,j in enumerate(color_list):
    hist = cv2.calcHist([img_dst],[i],None,[256],[0,256])
    ax2.plot(hist,color = j)

f:id:bitop:20180212062412p:plain

f:id:bitop:20180212062440p:plain

f:id:bitop:20180212062515p:plain

Interface2017年05月号新画像処理101を読む

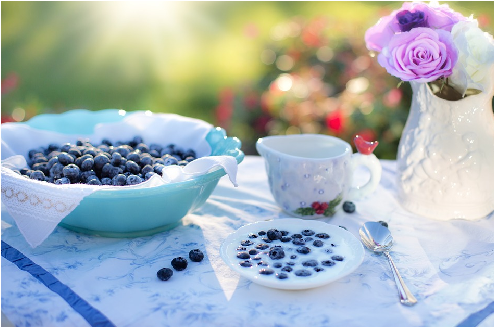
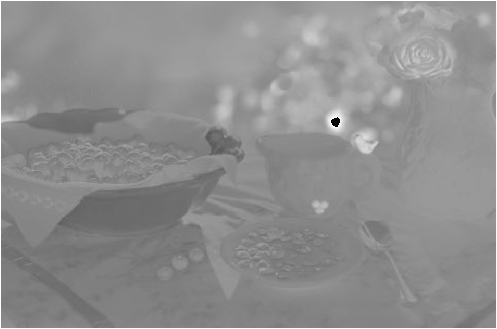
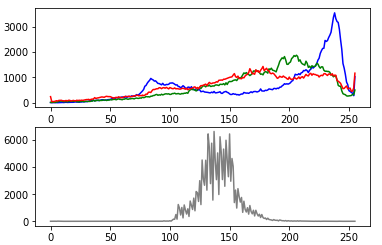
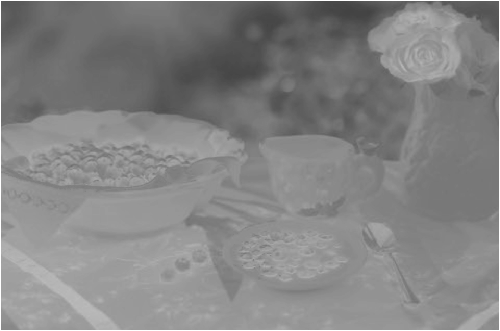
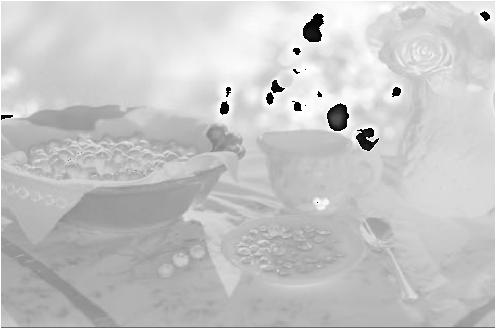
3-6 JPEG画像の色差信号の一つ「YCbCrのCr画像」

img_src = cv2.imread("data/img_3-5.bmp")

img_gray = -img_src[:,:,0] * 0.081 - img_src[:,:,1] * 0.41869 + img_src[:,:,2] * 0.5 + 127

#img_srcと同じ大きさのゼロ配列を作成してimg_dstを構成
img_dst = np.zeros_like(img_src)

#グレイ画像の明度を調整
img_dst [:,:,0] = img_gray
img_dst [:,:,1] = img_gray
img_dst [:,:,2] = img_gray

#描画する
cv2.imshow("img_src",img_src)
cv2.imshow("img_dst",img_dst)
cv2.waitKey(0)
cv2.destroyAllWindows()


#ヒストグラム
fig = plt.figure()
ax1 = fig.add_subplot(211) #総行数,総列数、サブプロット番号
ax2 = fig.add_subplot(212)

color_list = ["blue","green","red"]
for i,j in enumerate(color_list):
    hist = cv2.calcHist([img_src],[i],None,[256],[0,256])
    ax1.plot(hist,color = j)
color_list = ["gray"]
for i,j in enumerate(color_list):
    hist = cv2.calcHist([img_dst],[i],None,[256],[0,256])
    ax2.plot(hist,color = j)
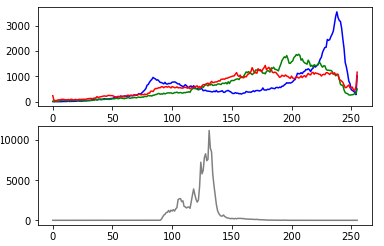
f:id:bitop:20180203081129p:plain

f:id:bitop:20180210062208p:plain

f:id:bitop:20180210062301p:plain

Interface2017年05月号新画像処理101を読む

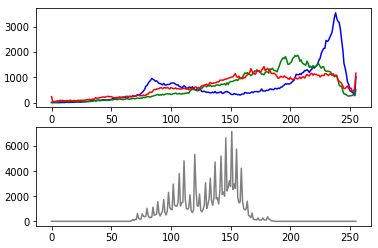
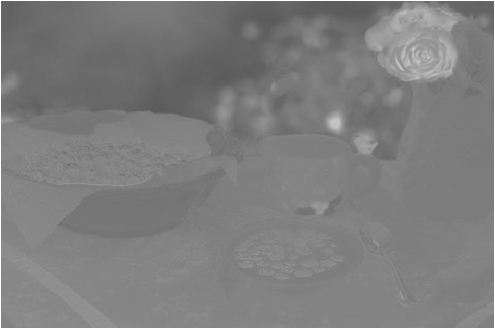
3-5 JPEG画像の色差信号の一つ「YCbCrのCb画像」

img_src = cv2.imread("data/img_3-5.bmp")

img_gray = img_src[:,:,0] * 0.5 - img_src[:,:,1] * 0.33126 - img_src[:,:,2] * 0.16874 + 127

#img_srcと同じ大きさのゼロ配列を作成してimg_dstを構成
img_dst = np.zeros_like(img_src)

#グレイ画像の明度を調整
img_dst [:,:,0] = img_gray
img_dst [:,:,1] = img_gray
img_dst [:,:,2] = img_gray

#描画する
cv2.imshow("img_src",img_src)
cv2.imshow("img_dst",img_dst)
cv2.waitKey(0)
cv2.destroyAllWindows()


#ヒストグラム
fig = plt.figure()
ax1 = fig.add_subplot(211) #総行数,総列数、サブプロット番号
ax2 = fig.add_subplot(212)

color_list = ["blue","green","red"]
for i,j in enumerate(color_list):
    hist = cv2.calcHist([img_src],[i],None,[256],[0,256])
    ax1.plot(hist,color = j)
color_list = ["gray"]
for i,j in enumerate(color_list):
    hist = cv2.calcHist([img_dst],[i],None,[256],[0,256])
    ax2.plot(hist,color = j)

f:id:bitop:20180203081129p:plain

f:id:bitop:20180207054319p:plain

f:id:bitop:20180207054359p:plain

Interface2017年05月号新画像処理101を読む

3-4 人間の目に鈍感な色変化を示す「Q画像」(YIQフォーマット)

img_src = cv2.imread("data/img_3-4.bmp")

img_gray = img_src[:,:,0] * 0.311 - img_src[:,:,1] * 0.528 + img_src[:,:,2] * 0.212 + 127

#img_srcと同じ大きさのゼロ配列を作成してimg_dstを構成
img_dst = np.zeros_like(img_src)

#グレイ画像の明度を調整
img_dst [:,:,0] = img_gray
img_dst [:,:,1] = img_gray
img_dst [:,:,2] = img_gray

#描画する
cv2.imshow("img_src",img_src)
cv2.imshow("img_dst",img_dst)
cv2.waitKey(0)
cv2.destroyAllWindows()


#ヒストグラム
fig = plt.figure()
ax1 = fig.add_subplot(211) #総行数,総列数、サブプロット番号
ax2 = fig.add_subplot(212)

color_list = ["blue","green","red"]
for i,j in enumerate(color_list):
    hist = cv2.calcHist([img_src],[i],None,[256],[0,256])
    ax1.plot(hist,color = j)
color_list = ["gray"]
for i,j in enumerate(color_list):
    hist = cv2.calcHist([img_dst],[i],None,[256],[0,256])
    ax2.plot(hist,color = j)

f:id:bitop:20180203081129p:plain

f:id:bitop:20180205055517p:plain

f:id:bitop:20180205055548p:plain

Interface2017年05月号新画像処理101を読む

3-3 人間の目に敏感な色変化を示す「I画像」(YIQフォーマット)

img_src = cv2.imread("data/img_3-3.bmp")

img_gray = -img_src[:,:,0] * 0.322 - img_src[:,:,1] * 0.274 + img_src[:,:,2] * 0.596 + 127

#img_srcと同じ大きさのゼロ配列を作成してimg_dstを構成
img_dst = np.zeros_like(img_src)

#グレイ画像の明度を調整
img_dst [:,:,0] = img_gray
img_dst [:,:,1] = img_gray
img_dst [:,:,2] = img_gray

#描画する
cv2.imshow("img_src",img_src)
cv2.imshow("img_dst",img_dst)
cv2.waitKey(0)
cv2.destroyAllWindows()


#ヒストグラム
fig = plt.figure()
ax1 = fig.add_subplot(211) #総行数,総列数、サブプロット番号
ax2 = fig.add_subplot(212)

color_list = ["blue","green","red"]
for i,j in enumerate(color_list):
    hist = cv2.calcHist([img_src],[i],None,[256],[0,256])
    ax1.plot(hist,color = j)
color_list = ["gray"]
for i,j in enumerate(color_list):
    hist = cv2.calcHist([img_dst],[i],None,[256],[0,256])
    ax2.plot(hist,color = j)

f:id:bitop:20180203081129p:plain

f:id:bitop:20180204060713p:plain

f:id:bitop:20180204060743p:plain