インポート
import numpy as np
import pandas as pd
import matplotlib.pylab as plt
import seaborn as sns
# matplotlib.patchesは円や長方形などの図形を描く。
import matplotlib.patches as patches
sns.set_style("whitegrid")

!dir input


playlist = pd.read_csv('input/PlayList.csv')
inj = pd.read_csv('input/InjuryRecord.csv')
trk = pd.read_csv('input/PlayerTrackData.csv')

inj.head()

print(inj.shape)

print('-'*50,'PlayerKey','-'*50)
print(inj['PlayerKey'].unique()); print(len(inj['PlayerKey'].unique()))

print('-'*50,'GameID','-'*50)
print(inj['GameID'].unique()); print(len(inj['GameID'].unique()))

print('-'*50,'PlayKey','-'*50)
print(inj['PlayKey'].unique()); print(len(inj['PlayKey'].unique()))

print('-'*50,'BodyPart','-'*50)
print(inj['BodyPart'].unique()); print(len(inj['BodyPart'].unique()))

print('-'*50,'Surface','-'*50)
print(inj['Surface'].unique()); print(len(inj['Surface'].unique()))

print('-'*50,'DM_M1','-'*50)
print(inj['DM_M1'].unique()); print(len(inj['DM_M1'].unique()))

print('-'*50,'DM_M7','-'*50)
print(inj['DM_M7'].unique()); print(len(inj['DM_M7'].unique()))

print('-'*50,'DM_M28','-'*50)
print(inj['DM_M28'].unique()); print(len(inj['DM_M28'].unique()))

print('-'*50,'DM_M42','-'*50)
print(inj['DM_M42'].unique()); print(len(inj['DM_M42'].unique()))

# 28 Injurties without PlayKey
# playKeyに28の欠損値がある
inj['PlayKey'].isna().sum()

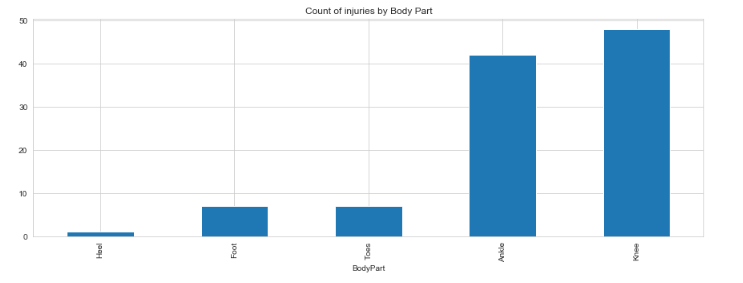
# BodyPartは5パートある(足首とか)
# そのパートごとにPlayerが何人いるか数えて棒グラフにする。膝が一番多い、次が足首
inj.groupby('BodyPart').count()['PlayerKey'] \
    .sort_values() \
    .plot(kind='bar', figsize=(15, 5), title='Count of injuries by Body Part')
plt.show()
# SurfaceはSynthetic,Natural
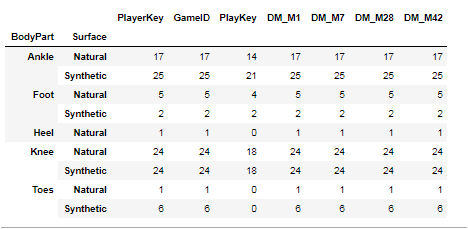
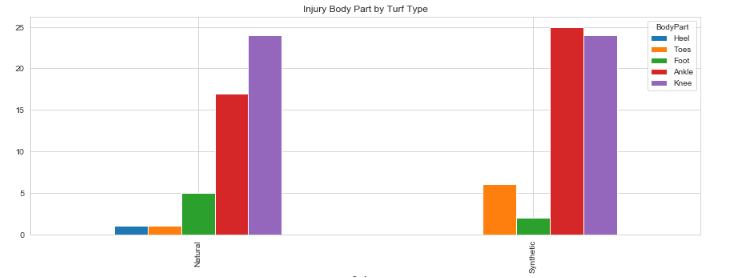
# チエーンがつながっているのでよくわからないので、分解して表示させた。
inj.groupby(['BodyPart','Surface']).count()
inj.groupby(['BodyPart','Surface']) \
    .count() \
    .unstack('BodyPart')['PlayerKey']

inj.groupby(['BodyPart','Surface']) \
    .count() \
    .unstack('BodyPart')['PlayerKey'] \
    .T.sort_values('Natural').T

inj.groupby(['BodyPart','Surface']) \
    .count() \
    .unstack('BodyPart')['PlayerKey'] \
    .T.sort_values('Natural').T \
    .sort_values('Ankle')

# Surfaceの意味がわからないのでいまひとつデータの解釈ができない
inj.groupby(['BodyPart','Surface']) \
    .count() \
    .unstack('BodyPart')['PlayerKey'] \
    .T.sort_values('Natural').T \
    .sort_values('Ankle') \
    .plot(kind='bar', figsize=(15, 5), title='Injury Body Part by Turf Type')
plt.show()
Playlist Data
playlist.head()

# Quarterback : クオータバック
# Wide Receiver : ワイド・レシーバー
# Linebacker : ラインバッカー
# Running Back : ランニングバック
# Defensive Lineman : ラインマン
# Tight End : タイトエンド
# Safety : セイフティ
# Cornerback : コーナーバック
# Offensive Lineman : オフェンシブライン

print(playlist['RosterPosition'].unique())

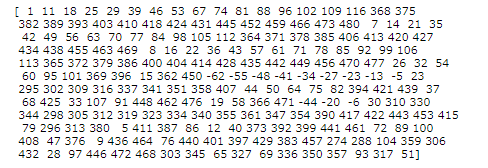
print(playlist['PlayerDay'].unique())
# スタジアムタイプ
print(playlist['StadiumType'].unique())

# フィールドが天然芝か合成芝かな
print(playlist['FieldType'].unique())

# 天気
# Clear and warm : Clear and warm
# Mostly Cloudy : だいたい曇など
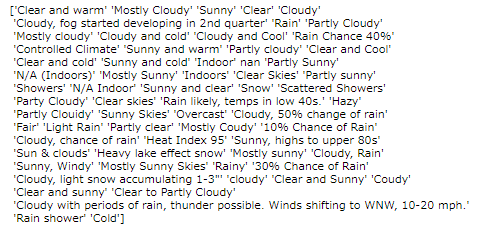
print(playlist['Weather'].unique())
# そのときのPlay Type
print(playlist['PlayType'].unique())

# RosterPositionとよく似ている、欠損値らしきものも
print(playlist['Position'].unique())

# PositionともRosterPositionとよく似ている
print(playlist['PositionGroup'].unique())

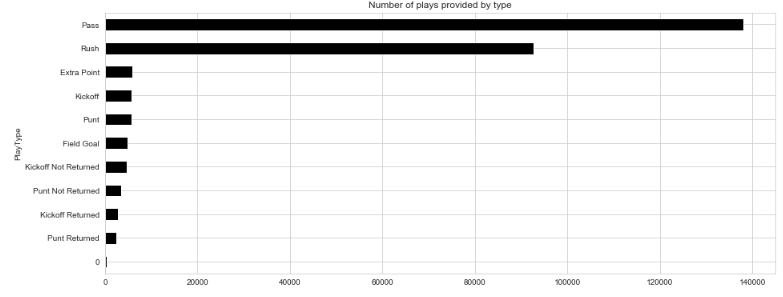
# Number of unique plays in the playlist dataset
playlist['PlayKey'].nunique()

playlist[['PlayKey','PlayType']].drop_duplicates() \
    .groupby('PlayType').count()['PlayKey'] \
    .sort_values() \
    .plot(kind='barh',
         figsize=(15, 6),
          color='black',
         title='Number of plays provided by type')
plt.show()
Match Player info with injury data(プレーヤー情報と傷害データを一致させる)
# PlayerKeyとPlaykeyとGameIDが一致する。全部で20のカラムとなる
inj_detailed = inj.merge(playlist)

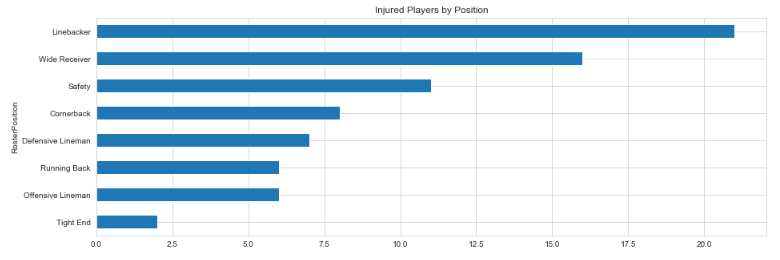
# 怪我をするPlayerはLinebacker Wide Receiverが多い
inj_detailed.groupby('RosterPosition').count()['PlayerKey'] \
    .sort_values() \
    .plot(figsize=(15, 5), kind='barh', title='Injured Players by Position')
plt.show()
# 怪我をするPlayTypeはPass Rushが多い
inj_detailed.groupby('PlayType').count()['PlayerKey'] \
    .sort_values() \
    .plot(figsize=(15, 5), kind='barh', title='Injured Players by PlayType', color='green')
plt.show()

Distribution of Injury Types(傷害タイプの分布)
# ポジションごとの怪我の部位の率
inj_detailed.groupby(['RosterPosition','BodyPart']) \
    .count() \
    .unstack('BodyPart')['PlayerKey'] \
    .T.apply(lambda x: x / x.sum()) \
    .sort_values('BodyPart').T.sort_values('Ankle', ascending=False) \
    .plot(kind='barh',
          figsize=(15, 5),
          title='Injury Body Part by Player Position',
          stacked=True)
plt.show()

# PlayTypeごとの怪我の部位率
# 特徴的な分布がみられる
inj_detailed.groupby(['PlayType','BodyPart']) \
    .count() \
    .unstack('BodyPart')['PlayerKey'] \
    .T.apply(lambda x: x / x.sum()) \
    .sort_values('BodyPart').T.sort_values('Ankle', ascending=False) \
    .plot(kind='barh',
          figsize=(15, 5),
          title='Injury Body Part by Play Type',
          stacked=True)
plt.show()

# ポジションごとのフィールドの種類の分布
inj_detailed.groupby(['RosterPosition','Surface']) \
    .count() \
    .unstack('Surface')['PlayerKey'] \
    .T.apply(lambda x: x / x.sum()) \
    .sort_values('Surface').T.sort_values('Natural', ascending=False) \
    .plot(kind='barh',
          figsize=(15, 5),
          title='Injury Body Part by Turf Type',
          stacked=True)
plt.show()

Plotting Plays
#
def create_football_field(linenumbers=True,
                          endzones=True,
                          highlight_line=False,
                          highlight_line_number=50,
                          highlighted_name='Line of Scrimmage',
                          fifty_is_los=False,
                          figsize=(12, 6.33)):
    """
    Function that plots the football field for viewing plays.
    Allows for showing or hiding endzones.
    """
    rect = patches.Rectangle((0, 0), 120, 53.3, linewidth=0.1,
                             edgecolor='r', facecolor='darkgreen', zorder=0)

    fig, ax = plt.subplots(1, figsize=figsize)
    ax.add_patch(rect)

    plt.plot([10, 10, 10, 20, 20, 30, 30, 40, 40, 50, 50, 60, 60, 70, 70, 80,
              80, 90, 90, 100, 100, 110, 110, 120, 0, 0, 120, 120],
             [0, 0, 53.3, 53.3, 0, 0, 53.3, 53.3, 0, 0, 53.3, 53.3, 0, 0, 53.3,
              53.3, 0, 0, 53.3, 53.3, 0, 0, 53.3, 53.3, 53.3, 0, 0, 53.3],
             color='white')
    if fifty_is_los:
        plt.plot([60, 60], [0, 53.3], color='gold')
        plt.text(62, 50, '<- Player Yardline at Snap', color='gold')
    # Endzones
    if endzones:
        ez1 = patches.Rectangle((0, 0), 10, 53.3,
                                linewidth=0.1,
                                edgecolor='r',
                                facecolor='blue',
                                alpha=0.2,
                                zorder=0)
        ez2 = patches.Rectangle((110, 0), 120, 53.3,
                                linewidth=0.1,
                                edgecolor='r',
                                facecolor='blue',
                                alpha=0.2,
                                zorder=0)
        ax.add_patch(ez1)
        ax.add_patch(ez2)
    plt.xlim(0, 120)
    plt.ylim(-5, 58.3)
    plt.axis('off')
    if linenumbers:
        for x in range(20, 110, 10):
            numb = x
            if x > 50:
                numb = 120 - x
            plt.text(x, 5, str(numb - 10),
                     horizontalalignment='center',
                     fontsize=20,  # fontname='Arial',
                     color='white')
            plt.text(x - 0.95, 53.3 - 5, str(numb - 10),
                     horizontalalignment='center',
                     fontsize=20,  # fontname='Arial',
                     color='white', rotation=180)
    if endzones:
        hash_range = range(11, 110)
    else:
        hash_range = range(1, 120)

    for x in hash_range:
        ax.plot([x, x], [0.4, 0.7], color='white')
        ax.plot([x, x], [53.0, 52.5], color='white')
        ax.plot([x, x], [22.91, 23.57], color='white')
        ax.plot([x, x], [29.73, 30.39], color='white')

    if highlight_line:
        hl = highlight_line_number + 10
        plt.plot([hl, hl], [0, 53.3], color='yellow')
        plt.text(hl + 2, 50, '<- {}'.format(highlighted_name),
                 color='yellow')
    return fig, ax
Plot path of injured player
# trkは1秒に10回のplayerの位置情報
trk.head()

trk.tail()

trk.shape

fig, ax = create_football_field()
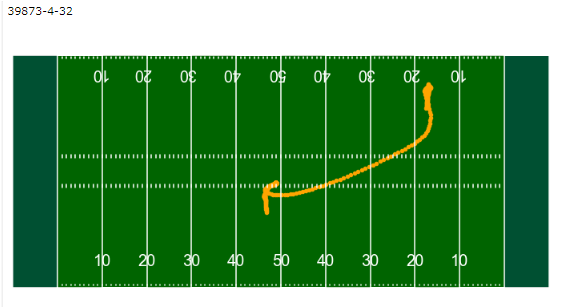
# player idを取り出しその位置情報(xとy)で散布図で描画させている
# query()メソッドの条件文字列の中で変数を使用するには変数名の前に@をつける。 https://note.nkmk.me/python-pandas-query/
example_play_id = inj['PlayKey'].values[0]
print(example_play_id)
fig, ax = create_football_field()
trk.query('PlayKey == @example_play_id').plot(kind='scatter', x='x', y='y', ax=ax, color='orange')
plt.show()
Plotting every route of injured players
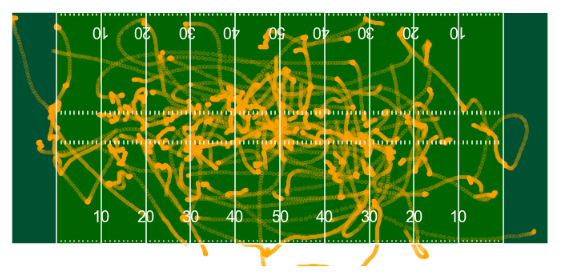
# Loop through all 99 inj plays
inj_play_list = inj['PlayKey'].tolist()
fig, ax = create_football_field()
for playkey, inj_play in trk.query('PlayKey in @inj_play_list').groupby('PlayKey'):
    inj_play.plot(kind='scatter', x='x', y='y', ax=ax, color='orange', alpha=0.2)
plt.show()
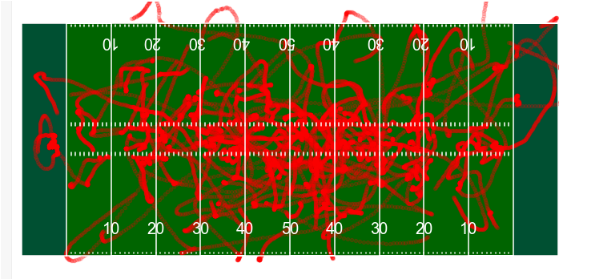
Plotting routes of some non-injured players(負傷していないプレイヤーのルートをプロットする)
import random
playids = trk['PlayKey'].unique() #.sample(100)
non_inj_play = [x for x in playids if x not in inj_play_list]
sample_non_inj_plays = random.sample(non_inj_play, 100)

fig, ax = create_football_field()
for playkey, inj_play in trk.query('PlayKey in @sample_non_inj_plays').groupby('PlayKey'):
    inj_play.plot(kind='scatter', x='x', y='y', ax=ax, color='red', alpha=0.2)
plt.show()
Distribution of tracking info for players with injuries(負傷したプレーヤーの追跡情報の配布)
print(trk['s'].max())
print(trk['s'].min())

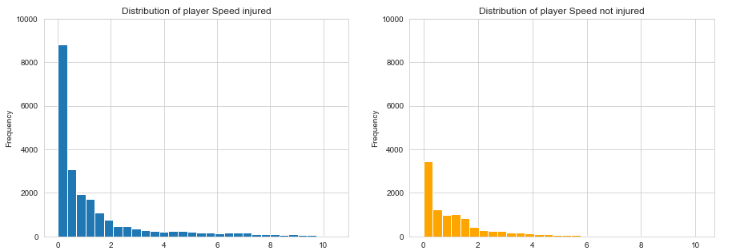
# playerのスピードを負傷者と非負傷者とで分布の違いを比較
fig, axes = plt.subplots(1, 2)

trk.query('PlayKey in @inj_play_list')['s'].plot(kind='hist',
                                                 title='Distribution of player Speed injured',
                                                 figsize=(15, 5), bins=30, ax=axes[0],ylim=[0,10000])
trk.query('PlayKey not in @inj_play_list')['s'].sample(10000).plot(kind='hist',
                                                 title='Distribution of player Speed not injured',
                                                 figsize=(15, 5), bins=30, ax=axes[1], color='orange',ylim=[0,10000])
plt.show()
fig, axes = plt.subplots(1, 2)

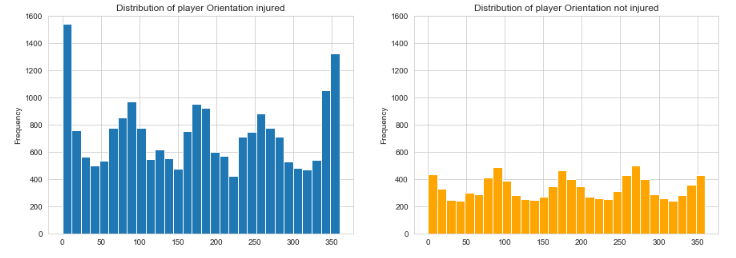
trk.query('PlayKey in @inj_play_list')['o'].plot(kind='hist',
                                                 title='Distribution of player Orientation injured',
                                                 figsize=(15, 5), bins=30, ax=axes[0],ylim=[0,1600])
trk.query('PlayKey not in @inj_play_list')['o'].sample(10000).plot(kind='hist',
                                                 title='Distribution of player Orientation not injured',
                                                 figsize=(15, 5), bins=30, ax=axes[1], color='orange',ylim=[0,1600])
plt.show()
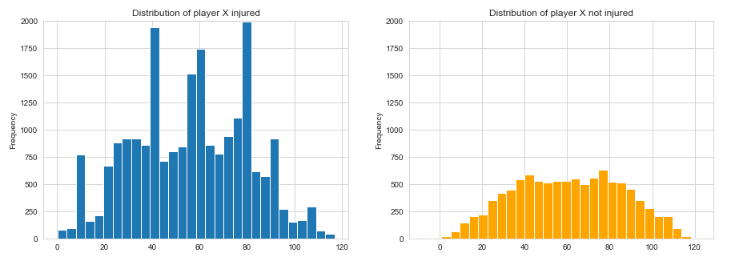
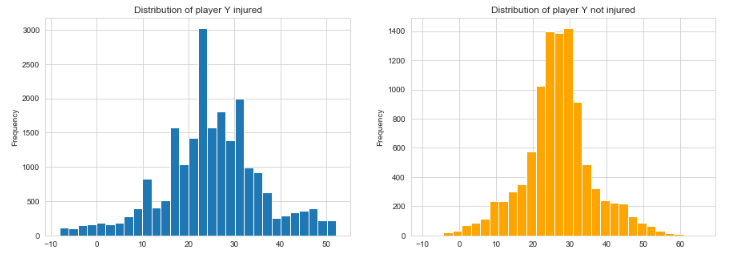
Differences in x, y could be attributed to the player positions which are more likely to have injury
(負傷の可能性が高いプレーヤーの位置に起因する可能性があります。)
# x座標で怪我の分布、広く分布しておりこれっと行った特徴なし
fig, axes = plt.subplots(1, 2)

trk.query('PlayKey in @inj_play_list')['x'].plot(kind='hist',
                                                 title='Distribution of player X injured',
                                                 figsize=(15, 5), bins=30, ax=axes[0],ylim=[0,2000])
trk.query('PlayKey not in @inj_play_list')['x'].sample(10000).plot(kind='hist',
                                                 title='Distribution of player X not injured',
                                                 figsize=(15, 5), bins=30, ax=axes[1], color='orange',ylim=[0,2000])
plt.show()
# 縦軸方向では中央で怪我が発生しやすいとわかりやすい特徴がでた
fig, axes = plt.subplots(1, 2)

trk.query('PlayKey in @inj_play_list')['y'].plot(kind='hist',
                                                 title='Distribution of player Y injured',
                                                 figsize=(15, 5), bins=30, ax=axes[0])
trk.query('PlayKey not in @inj_play_list')['y'].sample(10000).plot(kind='hist',
                                                 title='Distribution of player Y not injured',
                                                 figsize=(15, 5), bins=30, ax=axes[1], color='orange')
plt.show()
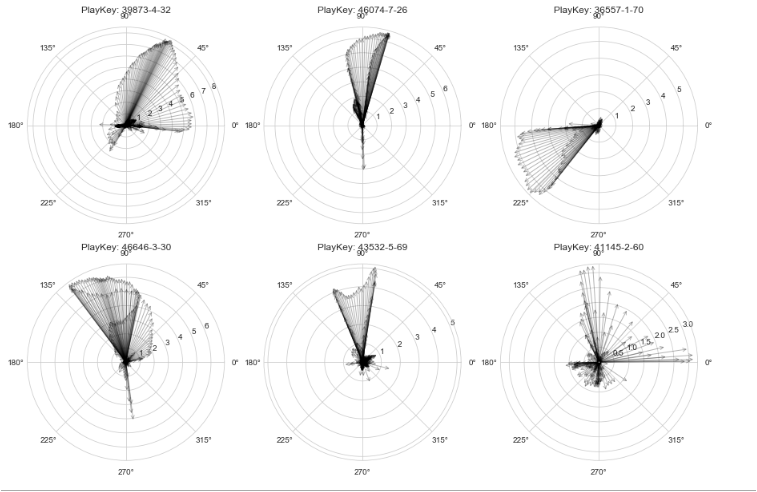
Compass plots of direction/velocity(方向/速度のコンパスプロット)
def compass(angles, radii, arrowprops=None, ax=None):
    """
    * Modified for NFL data plotting
    Compass draws a graph that displays the vectors with
    components `u` and `v` as arrows from the origin.

    Examples
    --------
    >>> import numpy as np
    >>> u = [+0, +0.5, -0.50, -0.90]
    >>> v = [+1, +0.5, -0.45, +0.85]
    >>> compass(u, v)
    """

    #angles, radii = cart2pol(u, v)
    if ax is None:
        fig, ax = plt.subplots(subplot_kw=dict(polar=True))

    kw = dict(arrowstyle="->", color='k')
    if arrowprops:
        kw.update(arrowprops)
    [ax.annotate("", xy=(angle, radius), xytext=(0, 0),
                 arrowprops=kw) for
     angle, radius in zip(angles, radii)]

    ax.set_ylim(0, np.max(radii))

    return ax

def plot_play_compass(playkey, **kwargs):
    d = trk.loc[trk['PlayKey'] == playkey].copy()
    d['dir_theta'] = d['dir'] * np.pi / 180
    # Calculate velocity in meters per second
    d['dis_meters'] = d['dis'] / 1.0936  # Add distance in meters
    # Speed
    d['dis_meters'] / 0.01
    d['v_mps'] = d['dis_meters'] / 0.1

    ax = compass(d['dir_theta'], d['v_mps'],
                  arrowprops={'alpha': 0.3},
                **kwargs)
    return ax

fig, axes = plt.subplots(2, 3,  subplot_kw=dict(polar=True), figsize=(15, 10))
axes = np.array(axes)
axes = axes.reshape(-1)

i = 0
for p in inj_detailed['PlayKey'].values[:6]:
    plot_play_compass(p, ax=axes[i])
    axes[i].set_title(f'PlayKey: {p}')
    i += 1
plt.show()
Player Position vs Compass Plot(プレイヤーの位置とコンパスのプロット)
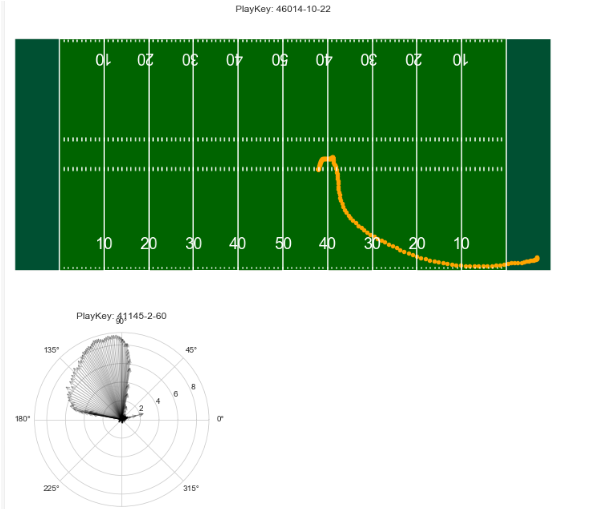
# Play Details
example_play_id = inj['PlayKey'].values[6]
inj_detailed.query('PlayKey == @example_play_id')

fig, ax = create_football_field(ax)
ax.set_title(f'PlayKey: {example_play_id}')
trk.query('PlayKey == @example_play_id').plot(kind='scatter', x='x', y='y', ax=ax, color='orange')
plt.show()

ax = plot_play_compass(example_play_id)
ax.set_title(f'PlayKey: {p}')
plt.show()
Plays by max speed
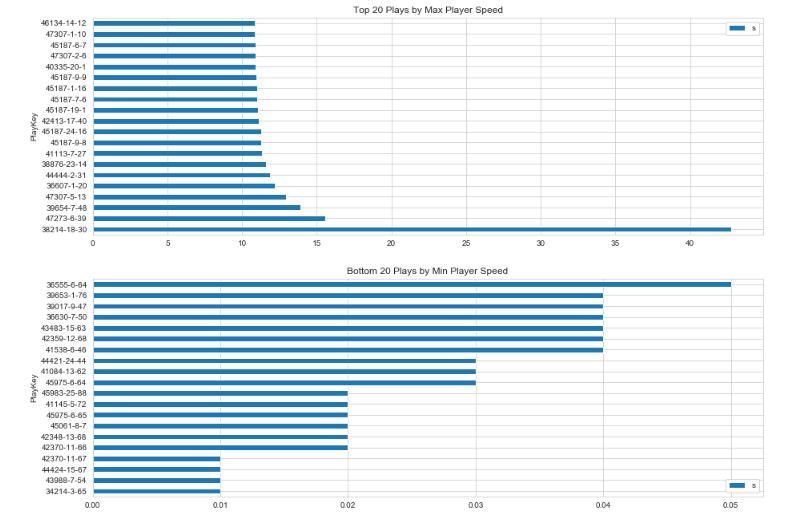
trk.groupby('PlayKey')[['s']].max() \
    .sort_values('s', ascending=False) \
    .query('s != 0').head(20) \
    .plot(kind='barh', figsize=(15, 5), title='Top 20 Plays by Max Player Speed')
plt.show()

trk.groupby('PlayKey')[['s']].max() \
    .sort_values('s', ascending=True) \
    .query('s != 0').head(20) \
    .plot(kind='barh', figsize=(15, 5), title='Bottom 20 Plays by Min Player Speed')
plt.show()
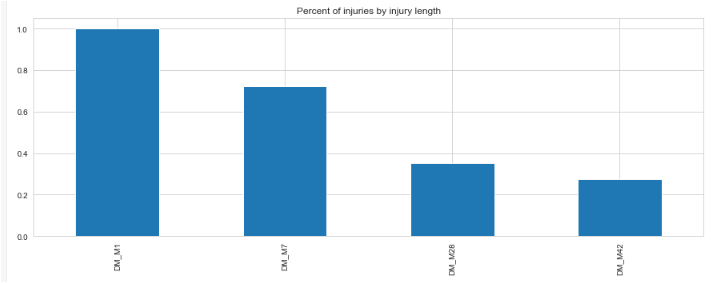
Injury Length(怪我の治療にかかった長さ?)
inj[['DM_M1','DM_M7','DM_M28','DM_M42']].mean() \
    .plot(figsize=(15, 5),
          kind='bar',
          title='Percent of injuries by injury length')
plt.show()
