Interface2017年05月号新画像処理101を読む
A-4 パターンを用いないハーフトーニング「フロイドスタインバーグ型誤差拡散法」
img_src = cv2.imread("data/img_A-3.bmp")
img_dst = np.empty_like(img_src)
#座標の大きさ
eight = img_src.shape[0]
width = img_src.shape[1]

for y in range(0,eight):
    for x in range(0,width):
        img_dst[y,x] = img_src[y,x]

for y in range(0,eight):
    for x in range(0,width):
        temp = float(img_src[y,x,0])
        if temp > 127:
            e = temp - 255
        else:
            e = temp

        if 1 <= x < width - 1 and 1 <= y < eight-1:
            img_dst[y    ,x+1,0] = float(img_dst[y,x+1,0]) + 0.3125*e
            img_dst[y+1,x-1,0] = float(img_dst[y+1,x-1,0]) + 0.1875*e
            img_dst[y+1,x   ,0] = float(img_dst[y+1,x,0]) + 0.3125*e
            img_dst[y+1,x+1,0] = float(img_dst[y+1,x+1,0]) + 0.1875*e

for y in range(0,eight):
    for x in range(0,width):
        temp = img_dst[y,x,0]
        img_dst[y,x] = [temp,temp,temp]


#描画する
cv2.imshow("img_src",img_src)
cv2.imshow("img_dst",img_dst)

cv2.waitKey(0)
cv2.destroyAllWindows()

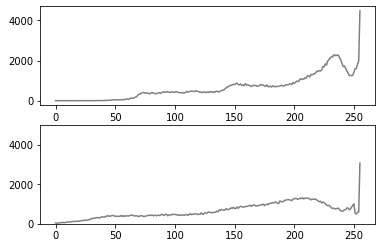
#ヒストグラム
fig = plt.figure()
ax1 = fig.add_subplot(211) #総行数,総列数、サブプロット番号
ax2 = fig.add_subplot(212)

color_list = ["gray"]
ax2.set_ylim(0,5000)
for i,j in enumerate(color_list):
    hist = cv2.calcHist([img_src],[i],None,[256],[0,256])
    ax1.plot(hist,color = j)

color_list = ["gray"]
ax2.set_ylim(0,5000)
for i,j in enumerate(color_list):
    hist = cv2.calcHist([img_dst],[i],None,[256],[0,256])
    ax2.plot(hist,color = j)
今回はうまくいかなかった


