「PythonとJavaScriptではじめるデータビジュアライゼーション」を読む

5.4ライブラリを使ったWEB APIへのアクセス

Tweetのアクセストークン他取得できなかったので省略

5.6 スープの取得

def get_Nobel_soup():
    response = requests.get(BASE_URL + '/wiki/List_of_Nobel_laureates',headers=HEADERS)
    return BeautifulSoup(response.content,"lxml")

BASE_URL = "http://en.wikipedia.org"
HEADERS = {'User-Agent':'Mozilla/5.0'}
get_Nobel_soup()

このコードが取得するのが下表である
f:id:bitop:20170915125245p:plain

取得したHTMLの一部
ここからテーブルの定義が始まる

b'<table class="wikitable sortable">\n  
テーブルヘッダの定義  
行タグ  
<tr>\n  
1列目のヘッダ 西暦  
<th>Year</th>\n  
2列目のヘッダ物理学賞の列、リンク先のアドレスも指定してある  
<th width="18%"><a href="/wiki/List_of_Nobel_laureates_in_Physics" title="List of Nobel laureates in Physics">Physics</a></th>\n  
3列目のヘッダ化学学賞の列、リンク先のアドレスも指定してある  
<th width="16%"><a href="/wiki/List_of_Nobel_laureates_in_Chemistry" title="List of Nobel laureates in Chemistry">Chemistry</a> 
</th>\n
4列目のヘッダ生理学・医学賞の列、リンク先のアドレスも指定してある  
<th width="18%"><a href="/wiki/List_of_Nobel_laureates_in_Physiology_or_Medicine" title="List of Nobel laureates in Physiology or Medicine">Physiology<br/>\nor Medicine</a></th>\n  
5列目のヘッダ文学賞の列、リンク先のアドレスも指定してある  
<th width="16%"><a href="/wiki/List_of_Nobel_laureates_in_Literature" title="List of Nobel laureates in Literature">Literature</a></th>\n  
6列目のヘッダ平和賞の列、リンク先のアドレスも指定してある  
<th width="16%"><a href="/wiki/List_of_Nobel_Peace_Prize_laureates" title="List of Nobel Peace Prize laureates">Peace</a></th>\n
7列目のヘッダ経済学賞の列、リンク先のアドレスも指定してある  
<th width="15%"><a class="mw-redirect" href="/wiki/List_of_Nobel_laureates_in_Economics" title="List of Nobel laureates in Economics">Economics</a></th>\n  
行タグ終了  
</tr>\n  
ここから表の中身  
行タグ  
<tr>\n  
表データ 1列目は西暦  
<td align="center">1901</td>\n  
物理学の受賞者 レントゲンのデータ  
<td>  

<span class="sortkey">  
R\xc3\xb6ntgen, Wilhelm  
</span>  

受賞者の名前とその人物ページへのアドレス  
<span class="vcard">  
<span class="fn">  
    <a href="/wiki/Wilhelm_R%C3%B6ntgen" title="Wilhelm R\xc3\xb6ntgen">Wilhelm R\xc3\xb6ntgen</a>  
</span>  
</span>  
データの終了、以降2列目から7列目までの受賞者が列記されている  
</td>\n  

最後にテーブルタグを閉じてあった。  
</table>'  

「PythonとJavaScriptではじめるデータビジュアライゼーション」を読む

5.3.1
import requests

OECD_ROOT_URL = 'http://stats.oecd.org/sdmx-json/data'

def make_OECD_request(dsname,dimensions,params=None,roo_dir=OECD_ROOT_URL):
    if params is None:
        params = {}

    dim_args = ['+'.join(d) for d in dimensions]
    dim_str = '.'.join(dim_args)
    url = roo_dir + '/' +dsname + '/' + dim_str + '/all' 
    print('Requesting URL: ' + url)
    return requests.get(url,params=params)

reaponse = make_OECD_request('QNA',(('USA','AUS'),('GDP','B1_GE'),('CUR','VOBARSA'),('Q')),{'startTime':'2009-Q1','endTime':'2010-Q1'})

if reaponse.status_code == 200:
    json =reaponse.json()
    key = json.keys()
    print(json['header'])
    print('--------------------\n')
    print(json['dataSets'])
    print('--------------------\n')
    print(json['structure'])        print(json.keys())
else:
    print(reaponse.status_code)

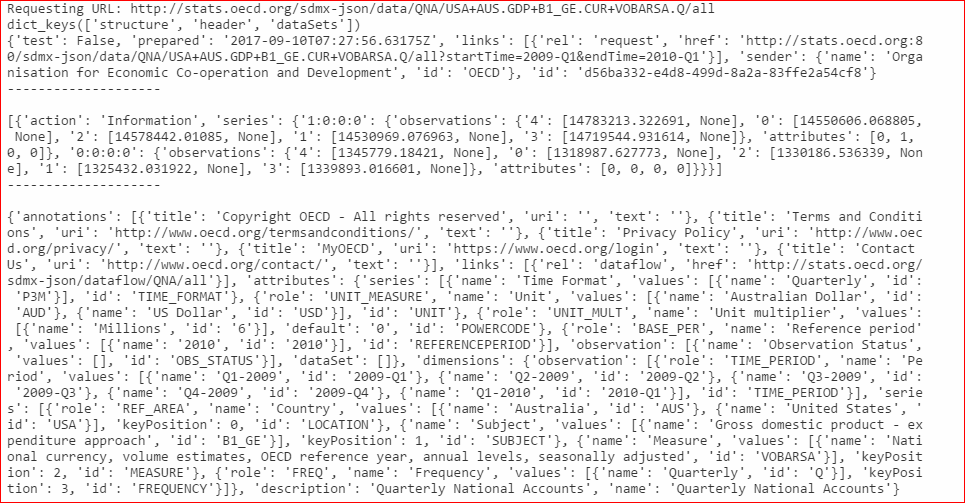
結果 f:id:bitop:20170911110948p:plain

5.3.2ノーベル賞データ可視化のための国データの取得
import requests

REST_EU_ROOT_URL = 'http://restcountries.eu/rest/v1'

def REST_country_request(field='all',name='',params=None):
    headers = {'User-Agent':'Mozilla/5.0'}
    if params is None:
        params = {}
    if field == 'all':
        return requests.get(REST_EU_ROOT_URL + '/all')
    url = '%s/%s/%s'%(REST_EU_ROOT_URL,field,name)
    print('Reqursting URL: ' + url)
    response = requests.get(url,params=params,headers=headers)
    if not response.status_code == 200:
        raise Exception('Request failed with status code ' + str(response.status_code))
    return response

response = REST_country_request('currency','usd')
json =  response.json()
for key,value in json[0].items():
    print(key,str(value).encode('UTF-8'))

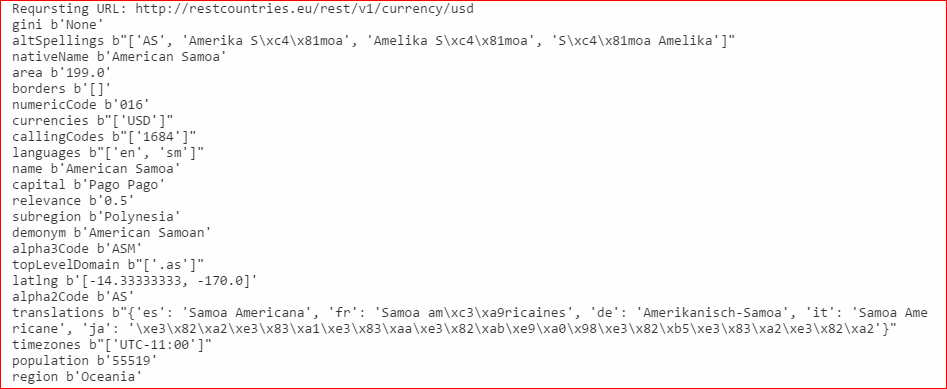
結果(日本語表記がおかしい)

f:id:bitop:20170911120611p:plain

「PythonとJavaScriptではじめるデータビジュアライゼーション」を読む

5.2requestsを使ったデータファイルの取得

import requests

response = requests.get("http://en.wikipedia.org/wiki/Nobel_Prize")
for resule in response:
    print(resule)

結果
膨大なHTML Docが返されてくる
取得したページ
f:id:bitop:20170911085839p:plain

import requests

response = requests.get("http://en.wikipedia.org/wiki/Nobel_Prize")
print(dir(response))

結果

__attrs__
__bool__
__class__
__delattr__
__dict__
__dir__
__doc__
__eq__
__format__
__ge__
__getattribute__
__getstate__
__gt__
__hash__
__init__
__iter__
__le__
__lt__
__module__
__ne__
__new__
__nonzero__
__reduce__
__reduce_ex__
__repr__
__setattr__
__setstate__
__sizeof__
__str__
__subclasshook__
__weakref__
_content
_content_consumed
apparent_encoding
close
connection
content
cookies
elapsed
encoding
headers
history
is_permanent_redirect
is_redirect
iter_content
iter_lines
json
links
ok
raise_for_status
raw
reason
request
status_code
text
url

-

import requests

response = requests.get("http://en.wikipedia.org/wiki/Nobel_Prize")
print(response.status_code)

結果
200

import requests

response = requests.get("http://en.wikipedia.org/wiki/Nobel_Prize")
print(response.headers)

結果(一部)

f:id:bitop:20170911091053p:plain

import requests

response = requests.get("http://en.wikipedia.org/wiki/Nobel_Prize")
print(response.text.encode('utf-8'))

結果(量が膨大なので省略)

import requests

response = requests.get("https://chhs.data.ca.gov/api/views/pbxw-hhq8/rows.json?accessType=DOWNLOAD")
print(response.status_code)

結果
404
サイト内で"pbxw-hhq8"を検索してみると https://data.chhs.ca.gov/dataset/food-affordability-2006-2010がそのデータらしい。データ形式CSV,PDF,XLSが用意されていたがjsonはなかった。

「PythonとJavaScriptではじめるデータビジュアライゼーション」を読む

4.7.3円
<!-- index.html -->
<!DOCTYPE html>
<meta charset="utf-8">
<style>
    svg#chart{
        background: lightgray;
    }
</style>
<svg id="chart" width="300" height="225">
    <circle r="15" cx="100" cy="50"></circle>
</svg>
<body>
    <script src="http://d3js.org/d3.v3.min.js"></script>
    <script src="script.js"></script>
</body>

結果

f:id:bitop:20170910152230p:plain

4.7.4 CSSスタイルの運用
<!-- index.html -->
<!DOCTYPE html>
<meta charset="utf-8">
<style>
    svg#chart{
        background: lightgray;
    }
    #chart circle{fill:lightblue}
</style>
<svg id="chart" width="300" height="225">
    <circle r="15" cx="100" cy="50"></circle>
</svg>
<body>
    <script src="http://d3js.org/d3.v3.min.js"></script>
    <script src="script.js"></script>
</body>

結果

f:id:bitop:20170910152625p:plain

4.7.5線、矩形、多角形
<!-- index.html -->
<!DOCTYPE html>
<meta charset="utf-8">
<style>
    svg#chart{
        background: lightcoral;
    }
    #chart circle{fill:lightblue}
    #chart line{stroke: #555555;stroke-width: 2}
    #chart rect{stroke: red;fill: white}
    #chart polygon{fill:green}
</style>
<svg id="chart" width="300" height="225">
    <circle r="15" cx="100" cy="50"></circle>
    <line x1="20" y1="20" x2="20" y2="130"></line>
    <line x1="20" y1="130" x2="280" y2="130"></line>
    <rect x="240" y="5" width="55" height="30"></rect>
    <polygon points="210,100,230,100,220,80"></polygon>
</svg>
<body>
    <script src="http://d3js.org/d3.v3.min.js"></script>
    <script src="script.js"></script>
</body>

結果

f:id:bitop:20170910155743p:plain

4.7.6テキスト
<!-- index.html -->
<!DOCTYPE html>
<meta charset="utf-8">
<style>
    svg#chart{
        background: lightcoral;
    }
    #chart circle{fill:lightblue}
    #chart line{stroke: #555555;stroke-width: 2}
    #chart rect{stroke: red;fill: white}
    #chart polygon{fill:green}
</style>
<svg id="chart" width="300" height="225">
    <circle r="15" cx="100" cy="50"></circle>
    <line x1="20" y1="20" x2="20" y2="130"></line>
    <line x1="20" y1="130" x2="280" y2="130"></line>
    <rect x="240" y="5" width="55" height="30"></rect>
    <polygon points="210,100,230,100,220,80"></polygon>
    <text id="title" text-anchor="middle" x="150" y="20">
        A Dummy Chart
    </text>
    <text x="20" y="20" transform="rotate(-90,20,20)" text-anchor="end" dy="0.71em">
        y axis label
    </text>
</svg>
<body>
    <script src="http://d3js.org/d3.v3.min.js"></script>
    <script src="script.js"></script>
</body>

結果

f:id:bitop:20170910164501p:plain

4.7.7パス
<!-- index.html -->
<!DOCTYPE html>
<meta charset="utf-8">
<style>
    svg#chart{
        background: lightcoral;
    }
    #chart circle{fill:lightblue}
    #chart line{stroke: #555555;stroke-width: 2}
    #chart rect{stroke: red;fill: white}
    #chart polygon{fill:green}
    #chart path{stroke:red; fill:none}
</style>
<svg id="chart" width="300" height="225">
    <circle r="15" cx="100" cy="50"></circle>
    <line x1="20" y1="20" x2="20" y2="130"></line>
    <line x1="20" y1="130" x2="280" y2="130"></line>
    <rect x="240" y="5" width="55" height="30"></rect>
    <polygon points="210,100,230,100,220,80"></polygon>
    <text id="title" text-anchor="middle" x="150" y="20">
        A Dummy Chart
    </text>
    <text x="20" y="20" transform="rotate(-90,20,20)" text-anchor="end" dy="0.71em">
        y axis label
    </text>
    <path d="M20 130L60 70L110 100L160 45"></path>
</svg>
<body>
    <script src="http://d3js.org/d3.v3.min.js"></script>
    <script src="script.js"></script>
</body>

結果

f:id:bitop:20170910170140p:plain

<!-- index.html -->
<!DOCTYPE html>
<meta charset="utf-8">
<style>
    svg#chart{
        background: lightgray;
    }
    #chart path{stroke:red; fill:none}
</style>
<svg id="chart" width="300" height="150">
    <path d="M40 40
            A30 40
            0 0 1
            80 80
            A50 50 0 0 1 160 80
            A30 30 0 0 1 190 80
    ">
</svg>
<body>
    <script src="http://d3js.org/d3.v3.min.js"></script>
    <script src="script.js"></script>
</body>

結果

f:id:bitop:20170910170712p:plain

<!-- index.html -->
<!DOCTYPE html>
<meta charset="utf-8">
<style>
    svg#chart{
        background: lightgray;
    }
    #chart path{stroke:red; fill:none}
</style>
<svg id="chart" width="300" height="150">
    <path d="M40 80
            A30 40 0 0 1 80 80
            A30 40 0 0 0 120 80
            A30 40 0 1 0 160 80
            A30 40 0 1 1 200 80
    ">
</svg>
<body>
    <script src="http://d3js.org/d3.v3.min.js"></script>
    <script src="script.js"></script>
</body>

結果

f:id:bitop:20170910171130p:plain

4.7.8拡大縮小と回転
<!-- index.html -->
<!DOCTYPE html>
<meta charset="utf-8">
<style>
    svg#chart{
        background: lightgray;
    }
    #chart path{stroke:red; fill:none}
</style>
<svg id="chart" width="300" height="150">
    <rect width="20" height="40" transform="translate(60,55)" fill="blue"/>
    <rect width="20" height="40" transform="translate(120,55),rotate(45)" fill="blue"/>
    <rect width="20" height="40" transform="translate(180,55),scale(0.5)" fill="blue"/>
    <rect width="20" height="40" transform="translate(240,55),rotate(45),scale(0.5)" fill="blue"/>
</svg>
<body>
    <script src="http://d3js.org/d3.v3.min.js"></script>
    <script src="script.js"></script>
</body>

結果

f:id:bitop:20170910172008p:plain

4.7.9グループ
<!-- index.html -->
<!DOCTYPE html>
<meta charset="utf-8">
<style>
    svg#chart{
        background: lightgray;
    }
</style>
<svg id="chart" width="300" height="150">
    <g id="shapes" transform="translate(150,75)">
        <circle cx="50" cy="0" r="25" fill="red"/>
        <rect x="30" y="10" width="40" height="20" fill="blue"/>
        <path d="M-20 -10 L50 -10L10 60Z" fill="green"/>
        <circle r="10" fill="yellow"/>
    </g>
</svg>
<body>
    <script src="http://d3js.org/d3.v3.min.js"></script>
    <script src="script.js"></script>
</body>

結果

f:id:bitop:20170910174012p:plain

<!-- index.html -->
<!DOCTYPE html>
<meta charset="utf-8">
<style>
    svg#chart{
        background: lightgray;
    }
    #chart circle{opacity:0.33}
</style>
<svg id="chart" width="300" height="150">
    <g transform="translate(150,75)">
        <circle cx="0" cy="-20" r="30" fill="red"/>
        <circle cx="17.3" cy="10" r="30" fill="green"/>
        <circle cx="-17.3" cy="10" r="30" fill="blue"/>
    </g>
</svg>
<body>
    <script src="http://d3js.org/d3.v3.min.js"></script>
    <script src="script.js"></script>
</body>

結果

f:id:bitop:20170911075434p:plain

4.7.11 JavaScriptによるSVG

index.html
<!-- index.html -->
<!DOCTYPE html>
<meta charset="utf-8">
<style>
    svg#chart{
        background: lightgray;
    }
    #chart circle{fill:red}
</style>
<body>
    <svg id="chart" >
    </svg>
    <script src="http://d3js.org/d3.v3.min.js"></script>
    <script src="script.js"></script>
</body>

script.js
var chartCircles = function(data){
var chart = d3.select('#chart');
chart.attr('height',data.height).attr('width',data.width);
chart.selectAll('circle').data(data.circle)
    .enter()
    .append('circle')
    .attr('cx',function(d){return d.x})
    .attr('cy',function(d){return d.y})
    .attr('r',function(d){return d.r});
};
var data ={
    width:300,height:150,
    circle:[
        {'x':50,'y':30,'r':20},
        {'x':70,'y':80,'r':10},
        {'x':160,'y':60,'r':10},
        {'x':200,'y':100,'r':5}            
    ]
};
chartCircles(data);

結果

f:id:bitop:20170911082642p:plain

「PythonとJavaScriptではじめるデータビジュアライゼーション」を読む

4.6プレースホルダを含む基本的なページ

<!-- index.html -->
<!DOCTYPE html>
<meta charset="utf-8">
<link rel="stylesheet" href="style1.css" type="text/css"/>
<body>
    <div id="chart-holder" class="dev">
        <div id="header">
            <h2>
                A Catchy Title Coming Soon ... 
            </h2>
            <p>Some body text describing what this visualization is all
                about and why you should care
            </p>

        </div>
        <div id="chart-components">
            <div id="main">
                A placeholder for the main chart
            </div>
            <div id="sidebar">
                <p>Some useful infomation about the chart,
                    probably changing with user interaction
                </p>
            </div>
        </div>
    </div>
    <script> src="script.js"</script>
</body>

body{
    background:#ccc;
    font-family:Sans-serif;
}
div.dev{
    border:solid 1px green;
}
div.dev div{
    border: dashed 1px green;
}
div#chart-holder{
    width: 600px;
    background: white;
    margin: auto;
    font-size: 16px;
}
div#chart-components{
    height: 400px;
    position: relative;
}
div#main,div#sidebar{
    position: absolute;
}
div#main{
    width: 75%;
    height: 100%;
    background: #eee;
}
div#sidebar{
    right: 0;
    width: 25%;
    height: 100%;
}

結果

f:id:bitop:20170910145907p:plain

「PythonとJavaScriptではじめるデータビジュアライゼーション」を読む

4.4.1
>python -m http.server

結果

f:id:bitop:20170910095726p:plain

4.4.3 HTMLスケルト
<!-- index.html -->
<!DOCTYPE html>
<meta charset="utf-8">
<div id='viz'>Hello</div>
<link rel="stylesheet" href="style.css"/>
<script src="https://cdnjs.cloudflare.com/ajax/libs/underscore.js/1.8.3/underscore-min.js"></script>
<script type="text/javascript" src="script.js" async></script>

Webブラウザーのアドレス欄にhttp://localhost:8000とアクセスする
結果

f:id:bitop:20170910100527p:plain

4.4.4 コンテンツのマークアップ
<!-- index.html -->
<!DOCTYPE html>
<meta charset="utf-8">
<body>
    <div id="my-chart-wrapper" class="chart-holder dev">
        <div id="my-chart class="bar chart">
            this is a placeholder,with paremt #my-chart-wrapper
        </div>
    </div>
</body>

結果

f:id:bitop:20170910104709p:plain

<!-- index.html -->
<!DOCTYPE html>
<meta charset="utf-8">
<body>
    <div id="inline-examples">
        <img src="toudai.jpg" id="prettypic">
        <p>This is a <a href="link-url">link</a> to
            <span class="url">link-url</span></p>
    </div>
</body>

結果

f:id:bitop:20170910110846p:plain

<!-- index.html -->
<!DOCTYPE html>
<meta charset="utf-8">
<body>
    <ol>
        <li>First item</li>
        <li>second item</li>
    </ol>
</body>

結果

f:id:bitop:20170910111338p:plain

<!-- index.html -->
<!DOCTYPE html>
<meta charset="utf-8">
<body>
    <table id="chart-data">
        <tr>
            <th>Name</th>
            <th>Category</th>
            <th>Country</th>
        </tr>
        <tr>
            <td>Albert Einstein</td>
            <td>Physics</td>
            <td>Switzerland</td>
        </tr>
    </table>
</body>

結果

f:id:bitop:20170910111544p:plain

4.4.5CSS
<!-- index.html -->
<!DOCTYPE html>
<meta charset="utf-8">
<style>
    #my-viz {font-family:'Helvetica Neue'
                Helvetica,Arial,sans-serif;}
    #lead {font-size:150%;}
    .alert {color:red;background: yellow}
</style>
<body>
    <div id="my-viz">
        <div id="lead">
            <h2>A Leader header</h2>
            <p>Some enlarged text for
                <span class="alert">
                    emphasis
                </span>
            </p>
        </div>
        <p>
            and some normal sized text with our chosen font
        </p>
        <div id="chart-horder">
            <svg></svg>
        </div>
    </div>
</body>

結果

f:id:bitop:20170910114507p:plain

「PythonとJavaScriptではじめるデータビジュアライゼーション」を読む

3.8日付、時刻、複合データ

d = datetime.now()
print(d.isoformat())
"""
iso 8601 fromat
yyyy-MM-ddTHH:mm:ss
日本標準時(JST)    2014-10-10T13:50:40+09:00
協定世界時(UTC)    2014-10-10T04:50:40Z
"""

結果

f:id:bitop:20170910095145p:plain

from dateutil import parser

d = parser.parser("2015-09-15T21:48:50.746Z")