Interface2017年05月号新画像処理101を読む

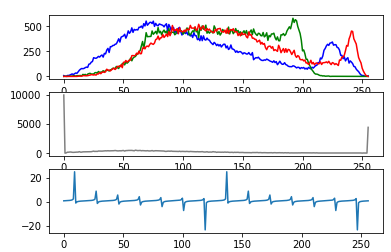
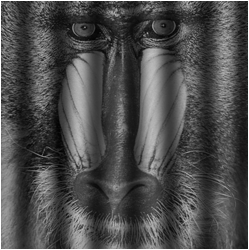
2-4 さざなみのようなゆれエフェクト「正接波揺らぎ」

img_src = cv2.imread("data/Mandrill.png")
img_gray = cv2.cvtColor(img_src,cv2.COLOR_RGB2GRAY)

#周波数
f = 7.0
#振幅
A = 0.3
#画面の横方向座標
#x
#width
#X
img_dst = np.zeros_like(img_gray)

Y = img_gray.shape[0]
X = img_gray.shape[1]
for y in range(Y):
    for x in range(X):
        p = (A * np.tan((f * 2.0 * np.pi * x)/X) + 2 * A ) * img_gray[y,x]
        if p > 255:
            p = 255
        elif p < 0:
            p = 0
        img_dst[y,x] = p

#描画する
cv2.imshow("img_src",img_src)
cv2.imshow("img_dst",img_dst)
cv2.waitKey(0)
cv2.destroyAllWindows()

#ヒストグラム
fig = plt.figure()
ax1 = fig.add_subplot(311) #総行数,総列数、サブプロット番号
ax2 = fig.add_subplot(312)
ax3 = fig.add_subplot(313)

color_list = ["blue","green","red"]
for i,j in enumerate(color_list):
    hist = cv2.calcHist([img_src],[i],None,[256],[0,256])
    ax1.plot(hist,color = j)
color_list = ["gray"]
for i,j in enumerate(color_list):
    hist = cv2.calcHist([img_dst],[i],None,[256],[0,256])
    ax2.plot(hist,color = j)

x=np.linspace(0,X,num=X - 1)
p = (A * np.tan((f * 2.0 * np.pi * x)/X) + 2 * A)
ax3.plot(x,p)    

f:id:bitop:20180115053703p:plain

f:id:bitop:20180126061701p:plain

f:id:bitop:20180126061746p:plain

Interface2017年05月号新画像処理101を読む

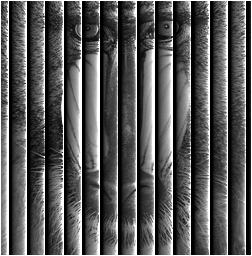
2-4 さざなみのようなゆれエフェクト「正弦波揺らぎ」

img_src = cv2.imread("data/Mandrill.png")
img_gray = cv2.cvtColor(img_src,cv2.COLOR_RGB2GRAY)

#周波数
f = 7.0
#振幅
A = 0.3
#画面の横方向座標
#x
#width
#X
img_dst = np.zeros_like(img_gray)

Y = img_gray.shape[0]
X = img_gray.shape[1]
for y in range(Y):
    for x in range(X):
        p = (A * np.sin((f * 2.0 * np.pi * x)/X) + 2 * A ) * img_gray[y,x]
        if p > 255:
            p = 255
        elif p < 0:
            p = 0
        img_dst[y,x] = p

#描画する
cv2.imshow("img_src",img_src)
cv2.imshow("img_dst",img_dst)
cv2.waitKey(0)
cv2.destroyAllWindows()

#ヒストグラム
fig = plt.figure()
ax1 = fig.add_subplot(311) #総行数,総列数、サブプロット番号
ax2 = fig.add_subplot(312)
ax3 = fig.add_subplot(313)

color_list = ["blue","green","red"]
for i,j in enumerate(color_list):
    hist = cv2.calcHist([img_src],[i],None,[256],[0,256])
    ax1.plot(hist,color = j)
color_list = ["gray"]
for i,j in enumerate(color_list):
    hist = cv2.calcHist([img_dst],[i],None,[256],[0,256])
    ax2.plot(hist,color = j)

x=np.linspace(0,X,num=X - 1)
p = (A * np.sin((f * 2.0 * np.pi * x)/X) + 2 * A)
ax3.plot(x,p)    

f:id:bitop:20180115053703p:plain

f:id:bitop:20180125054013p:plain

Interface2017年05月号新画像処理101を読む

2-3 1次関数による濃淡調整「折れ線トーンカーブ処理」

img_src = cv2.imread("data/Mandrill.png")

#ルックアップテーブルの設定
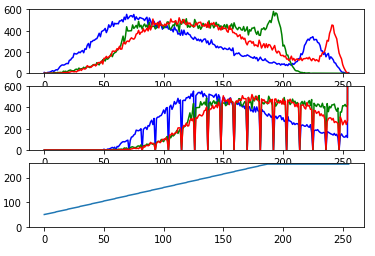
a = 1.1  #傾き
b = 50   #切片
look_up_table = np.zeros((256, 1), dtype = 'uint8')
for i in range(256):
    p = a * i + b
    if p > 255:
        p = 255
    if p < 0:
        p = 0
    look_up_table[i][0] = p

img_dst = cv2.LUT(img_src, look_up_table)

#描画する
cv2.imshow("img_src",img_src)
cv2.imshow("img_dst",img_dst)
cv2.waitKey(0)
cv2.destroyAllWindows()

#ヒストグラム
fig = plt.figure()
ax1 = fig.add_subplot(311) #総行数,総列数、サブプロット番号
ax2 = fig.add_subplot(312)
ax3 = fig.add_subplot(313)

color_list = ["blue","green","red"]
for i,j in enumerate(color_list):
    hist = cv2.calcHist([img_src],[i],None,[256],[0,256])
    ax1.plot(hist,color = j)
ax1.set_ylim(0,600)

for i,j in enumerate(color_list):
    hist = cv2.calcHist([img_dst],[i],None,[256],[0,256])
    ax2.plot(hist,color = j)
ax2.set_ylim(0,600)

x = [x for x in range(256)]
ax3.plot(x,look_up_table)  
ax3.set_ylim(0,260)

f:id:bitop:20180115055759p:plain

f:id:bitop:20180122061224p:plain

f:id:bitop:20180122061252p:plain

Interface2017年05月号新画像処理101を読む

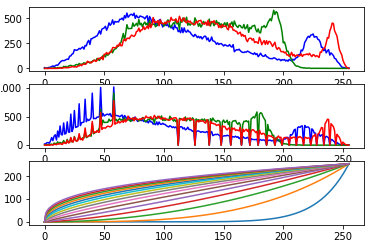
2-2 明るすぎたり暗すぎたりするときに有効「γ補正」

img_src = cv2.imread("data/Mandrill.png")

#ルックアップテーブルの設定
gamma = 0.8
look_up_table = np.zeros((256, 1), dtype = 'uint8')

for i in range(256):
    look_up_table[i][0] = 255 * pow(float(i) / 255, 1.0 / gamma)

img_dst = cv2.LUT(img_src, look_up_table)

#描画する
cv2.imshow("img_src",img_src)
cv2.imshow("img_dst",img_dst)
cv2.waitKey(0)
cv2.destroyAllWindows()

#ヒストグラム
fig = plt.figure()
ax1 = fig.add_subplot(311) #総行数,総列数、サブプロット番号
ax2 = fig.add_subplot(312)
ax3 = fig.add_subplot(313)

color_list = ["blue","green","red"]
for i,j in enumerate(color_list):
    hist = cv2.calcHist([img_src],[i],None,[256],[0,256])
    ax1.plot(hist,color = j)

for i,j in enumerate(color_list):
    hist = cv2.calcHist([img_dst],[i],None,[256],[0,256])
    ax2.plot(hist,color = j)

x = [x for x in range(256)]
for gamma in range(1,30,2): #gamma = 0.1,0.2,0.5 ... 2.9 
    lut = [255 * pow(float(x) / 255, 1.0 / (gamma/10)) for x in range(256)]
    ax3.plot(x,lut)    

f:id:bitop:20180121100734p:plain

f:id:bitop:20180121100802p:plain

f:id:bitop:20180121100831p:plain

Interface2017年05月号新画像処理101を読む

技2 明るさの調整

2-1 直線的に明るさを増減する「バイアス調整」

img_src = cv2.imread("data/Mandrill.png")
#cvtColor関数を使用してグレイ画像を作成
img_gray_origin = cv2.cvtColor(img_src,cv2.COLOR_RGB2GRAY) 

img_dst = np.zeros_like(img_gray_origin)

Y = img_gray_origin.shape[0]
X = img_gray_origin.shape[1]
for y in range(Y):
    for x in range(X):
        p = img_gray_origin[y,x] + 45
        if p > 255:
            p = 255
        elif p < 0:
            p = 0
        img_dst[y,x] = p

#描画する
cv2.imshow("img_src",img_gray_origin)
cv2.imshow("img_dst",img_dst)
cv2.waitKey(0)
cv2.destroyAllWindows()

#ヒストグラム
fig = plt.figure()
ax1 = fig.add_subplot(211) #総行数,総列数、サブプロット番号
ax2 = fig.add_subplot(212)
color_list = ["gray"]
for i,j in enumerate(color_list):
    hist = cv2.calcHist([img_gray_origin],[i],None,[256],[0,256])
    ax1.plot(hist,color = j)

for i,j in enumerate(color_list):
    hist = cv2.calcHist([img_dst],[i],None,[256],[0,256])
    ax2.plot(hist,color = j)

f:id:bitop:20180120140004p:plain

f:id:bitop:20180120140059p:plain

f:id:bitop:20180120140155p:plain

Interface2017年05月号新画像処理101を読む

1-7 モザイクをかける[モザイク画像処理]

# 画像の読み込み
img_src = cv2.imread("data/Mandrill.png")

# オリジナルのサイズを保存しておく。
#  shapeで取得できるサイズとresizeの引数に渡すサイズでは横縦の順番が違うらしい。ので[::-1]として反転。
origsize = img_src.shape[:2][::-1]
#1/20に縮小
img_tmp = cv2.resize(img_src, (int(origsize[0]/20), int(origsize[1]/20)))
# 画像を元のサイズに拡大。
img_dst = cv2.resize(img_tmp, origsize, interpolation=cv2.INTER_NEAREST)

#描画する
cv2.imshow("img_src",img_src)
cv2.imshow("img_dst",img_dst)
cv2.waitKey(0)
cv2.destroyAllWindows()

#ヒストグラム
fig = plt.figure()
ax1 = fig.add_subplot(211) #総行数,総列数、サブプロット番号
ax2 = fig.add_subplot(212)
color_list = ["blue","green","red"]
for i,j in enumerate(color_list):
    hist = cv2.calcHist([img_src],[i],None,[256],[0,256])
    ax1.plot(hist,color = j)

for i,j in enumerate(color_list):
    hist = cv2.calcHist([img_dst],[i],None,[256],[0,256])
    ax2.plot(hist,color = j)

f:id:bitop:20180115055759p:plain

f:id:bitop:20180119055919p:plain

f:id:bitop:20180119055948p:plain

Interface2017年05月号新画像処理101を読む

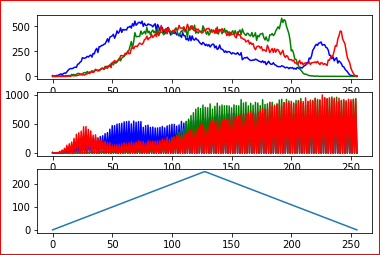
1-6 コントラストの改善が可能な画素値差表現[ソラリゼーション]

look_up_table = np.zeros((256, 1), dtype = 'uint8' ) 

for i in range(256):
    if i <= 127:
        look_up_table[i][0] = 2 * i
    else:
        look_up_table[i][0] = 255*2 - 2 * i

# 画像の読み込み
img_src = cv2.imread("data/Mandrill.png")

# ソラリゼーション
img_dst = cv2.LUT(img_src, look_up_table)

#描画する
cv2.imshow("img_src",img_src)
cv2.imshow("img_dst",img_dst)
cv2.waitKey(0)
cv2.destroyAllWindows()

#ヒストグラム
fig = plt.figure()
ax1 = fig.add_subplot(311) #総行数,総列数、サブプロット番号
ax2 = fig.add_subplot(312)
ax3 = fig.add_subplot(313)
color_list = ["blue","green","red"]
for i,j in enumerate(color_list):
    hist = cv2.calcHist([img_src],[i],None,[256],[0,256])
    ax1.plot(hist,color = j)

for i,j in enumerate(color_list):
    hist = cv2.calcHist([img_dst],[i],None,[256],[0,256])
    ax2.plot(hist,color = j)

x = [i for i in range(256)]
ax3.plot(x,look_up_table)

f:id:bitop:20180115055759p:plain

f:id:bitop:20180118052523p:plain

f:id:bitop:20180118052607p:plain