Interface2017年05月号新画像処理101を読む

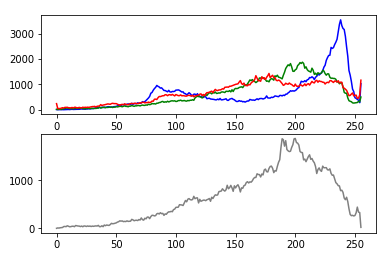
3-2 画像の明るさ強度を示す「Y画像」(YIQフォーマット)

img_src = cv2.imread("data/img_3-2.bmp")

img_gray = img_src[:,:,0] * 0.114478 + img_src[:,:,1] * 0.586611 + img_src[:,:,2] * 0.298912 

#img_srcと同じ大きさのゼロ配列を作成してimg_dstを構成
img_dst = np.zeros_like(img_src)

#グレイ画像の明度を調整
img_dst [:,:,0] = img_gray
img_dst [:,:,1] = img_gray
img_dst [:,:,2] = img_gray

#描画する
cv2.imshow("img_src",img_src)
cv2.imshow("img_dst",img_dst)
cv2.waitKey(0)
cv2.destroyAllWindows()


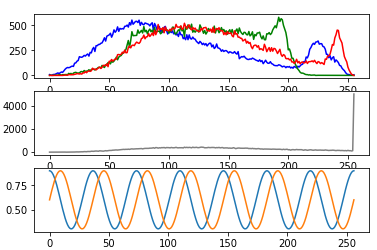
#ヒストグラム
fig = plt.figure()
ax1 = fig.add_subplot(211) #総行数,総列数、サブプロット番号
ax2 = fig.add_subplot(212)

color_list = ["blue","green","red"]
for i,j in enumerate(color_list):
    hist = cv2.calcHist([img_src],[i],None,[256],[0,256])
    ax1.plot(hist,color = j)
color_list = ["gray"]
for i,j in enumerate(color_list):
    hist = cv2.calcHist([img_dst],[i],None,[256],[0,256])
    ax2.plot(hist,color = j)
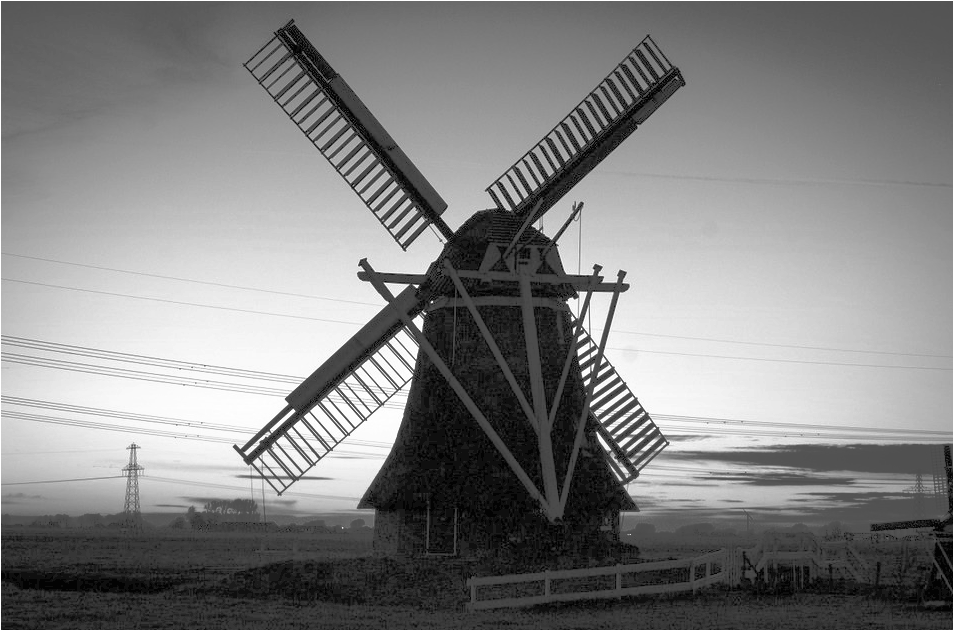
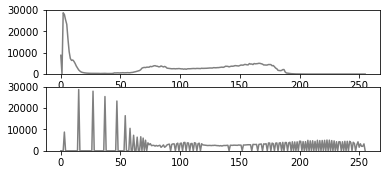
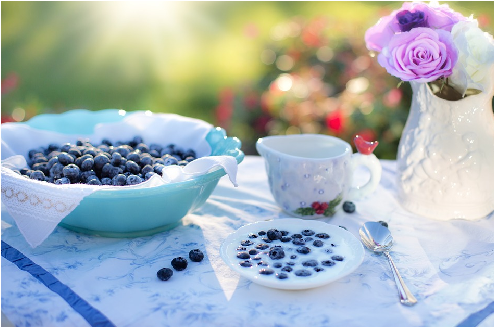
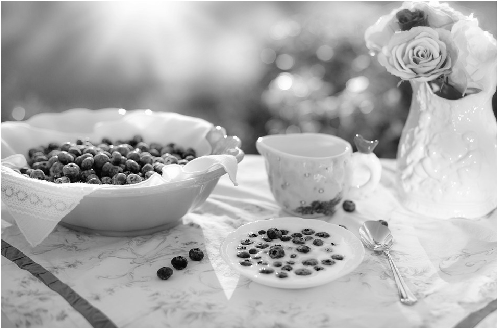
f:id:bitop:20180203081129p:plain

f:id:bitop:20180203081154p:plain

f:id:bitop:20180203081230p:plain

Interface2017年05月号新画像処理101を読む

技3 色フォーマット変換

3-1 画像の濃淡がひと目でつかめる「ヒストグラム

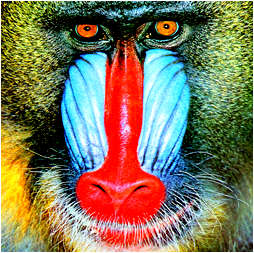
img_src = cv2.imread("data/Mandrill.png")
#cvtColor関数を使用してグレイ画像を作成
img_gray = cv2.cvtColor(img_src,cv2.COLOR_RGB2GRAY) 


#描画する
cv2.imshow("img_src",img_src)
cv2.imshow("img_gray",img_gray)
cv2.waitKey(0)
cv2.destroyAllWindows()

#ヒストグラム
fig = plt.figure()
ax1 = fig.add_subplot(211) #総行数,総列数、サブプロット番号
ax2 = fig.add_subplot(212)

color_list = ["blue","green","red"]
for i,j in enumerate(color_list):
    hist = cv2.calcHist([img_src],[i],None,[256],[0,256])
    ax1.plot(hist,color = j)
color_list = ["gray"]
for i,j in enumerate(color_list):
    hist = cv2.calcHist([img_gray],[i],None,[256],[0,256])
    ax2.plot(hist,color = j)

f:id:bitop:20180115053703p:plain

f:id:bitop:20180202061239p:plain

f:id:bitop:20180202061313p:plain

Interface2017年05月号新画像処理101を読む

2-6 もっとも優れたコントラスト改善法のひとつ「ヒストグラム平坦化」その2

#前の方法は時間がかかるので別の方法を試す
#http://labs.eecs.tottori-u.ac.jp/sd/Member/oyamada/OpenCV/html/py_tutorials/py_imgproc/py_histograms/py_histogram_equalization/py_histogram_equalization.html

img_src = cv2.imread('data/inpu_img_2-6.bmp',0)

# create a CLAHE object (Arguments are optional).
clahe = cv2.createCLAHE(clipLimit=2.0, tileGridSize=(8,8))
img_dst = clahe.apply(img_src)

cv2.imshow("img_src",img_src)
cv2.imshow("img_dst",img_dst)
cv2.waitKey(0)
cv2.destroyAllWindows()

f:id:bitop:20180130061531p:plain

f:id:bitop:20180131070210p:plain

Interface2017年05月号新画像処理101を読む

2-6 もっとも優れたコントラスト改善法のひとつ「ヒストグラム平坦化」

かなり時間がかかったpythonには向いていない

img_src = cv2.imread("data/inpu_img_2-6.bmp")

#画像の大きさ
eight = img_src.shape[0] #639
width = img_src.shape[1] #960
#ヒストグラムの作成
color_list = ["gray"]
for i,j in enumerate(color_list):
    hist = cv2.calcHist([img_src],[i],None,[256],[0,256])
#ヒストグラムの平均値
sum = 0
ehn = np.empty_like(hist)
for i in range(256):
    sum = sum + hist[i]
    ehn[i] = sum * 255/(eight*width)

img_dst = np.zeros_like(img_src)
for i in range(256):
    for y in range(eight):
        for x in range(width):
            if img_src[y,x,0] == i:
                img_dst [y,x,0] = ehn[i]
                img_dst [y,x,1] = ehn[i]
                img_dst [y,x,2] = ehn[i]

cv2.imshow("img_src",img_src)
cv2.imshow("img_dst",img_dst)
cv2.waitKey(0)
cv2.destroyAllWindows()

#ヒストグラム
fig = plt.figure()
ax1 = fig.add_subplot(311) #総行数,総列数、サブプロット番号
ax2 = fig.add_subplot(312)
ax1.set_ylim(0,30000)
ax2.set_ylim(0,30000)

color_list = ["gray"]
for i,j in enumerate(color_list):
    hist = cv2.calcHist([img_src],[i],None,[256],[0,256])
    ax1.plot(hist,color = j)
for i,j in enumerate(color_list):
    hist = cv2.calcHist([img_dst],[i],None,[256],[0,256])
    ax2.plot(hist,color = j)
f:id:bitop:20180130061531p:plain

f:id:bitop:20180130061602p:plain

f:id:bitop:20180130061635p:plain

Interface2017年05月号新画像処理101を読む

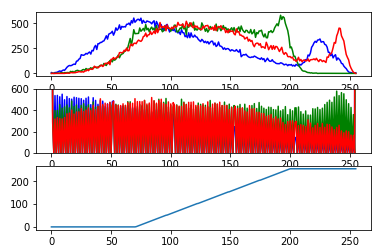
2-5 シンプルなコントラスト改善方法「コントラスト伸長」

img_src = cv2.imread("data/Mandrill.png")

#最小値
min = 70
#最大
max = 200

look_up_table = np.arange(256, dtype = np.uint8) 

for i in range(0,255):
    if i < min:
        look_up_table[i] = 0
    elif min <= i < max:
        look_up_table[i] = 255 * (i - min)/(max - min)
    else:
        look_up_table[i] = 255

img_dst = cv2.LUT(img_src, look_up_table)

#描画する
cv2.imshow("img_src",img_src)
cv2.imshow("img_dst",img_dst)
cv2.waitKey(0)
cv2.destroyAllWindows()

#ヒストグラム
fig = plt.figure()
ax1 = fig.add_subplot(311) #総行数,総列数、サブプロット番号
ax2 = fig.add_subplot(312)
ax3 = fig.add_subplot(313)

color_list = ["blue","green","red"]
for i,j in enumerate(color_list):
    hist = cv2.calcHist([img_src],[i],None,[256],[0,256])
    ax1.plot(hist,color = j)

ax2.set_ylim(0,600)
for i,j in enumerate(color_list):
    hist = cv2.calcHist([img_dst],[i],None,[256],[0,256])
    ax2.plot(hist,color = j)
x = [x for x in range(256)]
ax3.plot(x,look_up_table)  

f:id:bitop:20180115053703p:plain

f:id:bitop:20180129060534p:plain

f:id:bitop:20180129060613p:plain

Interface2017年05月号新画像処理101を読む

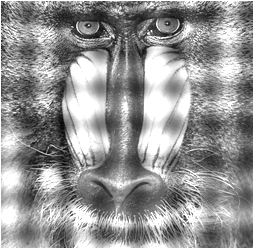
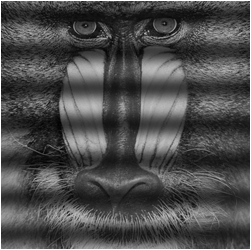
2-4 さざなみのようなゆれエフェクト「正弦波+余弦波揺らぎ」

img_src = cv2.imread("data/Mandrill.png")
img_gray = cv2.cvtColor(img_src,cv2.COLOR_RGB2GRAY)

#周波数
f = 7.0
#振幅
A = 0.3
#画面の縦方向座標
#y
#eight
#Y
img_dst = np.zeros_like(img_gray)

Y = img_gray.shape[0]
X = img_gray.shape[1]
for y in range(Y):
    for x in range(X):
        p = (A * np.cos((f * 2.0 * np.pi * y)/Y) + 2 * A ) * img_gray[y,x]
        p = p + (A * np.sin((f * 2.0 * np.pi * x)/X) + 2 * A ) * img_gray[y,x]
        if p > 255:
            p = 255
        elif p < 0:
            p = 0
        img_dst[y,x] = p

#描画する
cv2.imshow("img_src",img_src)
cv2.imshow("img_dst",img_dst)
cv2.waitKey(0)
cv2.destroyAllWindows()

#ヒストグラム
fig = plt.figure()
ax1 = fig.add_subplot(311) #総行数,総列数、サブプロット番号
ax2 = fig.add_subplot(312)
ax3 = fig.add_subplot(313)

color_list = ["blue","green","red"]
for i,j in enumerate(color_list):
    hist = cv2.calcHist([img_src],[i],None,[256],[0,256])
    ax1.plot(hist,color = j)
color_list = ["gray"]
for i,j in enumerate(color_list):
    hist = cv2.calcHist([img_dst],[i],None,[256],[0,256])
    ax2.plot(hist,color = j)
y=np.linspace(0,Y,num=Y - 1)
p1 = (A * np.cos((f * 2.0 * np.pi * y)/Y) + 2 * A)
p2 = (A * np.sin((f * 2.0 * np.pi * y)/X) + 2 * A )
ax3.plot(y,p1)    
ax3.plot(y,p2)    

f:id:bitop:20180115053703p:plain

f:id:bitop:20180128080259p:plain

f:id:bitop:20180128080333p:plain

Interface2017年05月号新画像処理101を読む

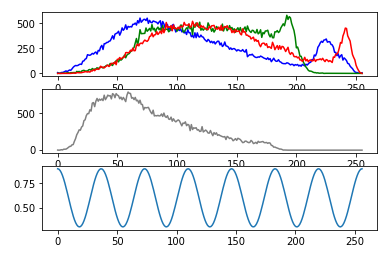
2-4 さざなみのようなゆれエフェクト「余弦波揺らぎ」

img_src = cv2.imread("data/Mandrill.png")
img_gray = cv2.cvtColor(img_src,cv2.COLOR_RGB2GRAY)

#周波数
f = 7.0
#振幅
A = 0.3
#画面の縦方向座標
#y
#eight
#Y
img_dst = np.zeros_like(img_gray)

Y = img_gray.shape[0]
X = img_gray.shape[1]
for y in range(Y):
    for x in range(X):
        p = (A * np.cos((f * 2.0 * np.pi * y)/Y) + 2 * A ) * img_gray[y,x]
        if p > 255:
            p = 255
        elif p < 0:
            p = 0
        img_dst[y,x] = p

#描画する
cv2.imshow("img_src",img_src)
cv2.imshow("img_dst",img_dst)
cv2.waitKey(0)
cv2.destroyAllWindows()

#ヒストグラム
fig = plt.figure()
ax1 = fig.add_subplot(311) #総行数,総列数、サブプロット番号
ax2 = fig.add_subplot(312)
ax3 = fig.add_subplot(313)

color_list = ["blue","green","red"]
for i,j in enumerate(color_list):
    hist = cv2.calcHist([img_src],[i],None,[256],[0,256])
    ax1.plot(hist,color = j)
color_list = ["gray"]
for i,j in enumerate(color_list):
    hist = cv2.calcHist([img_dst],[i],None,[256],[0,256])
    ax2.plot(hist,color = j)
y=np.linspace(0,Y,num=Y - 1)
p = (A * np.cos((f * 2.0 * np.pi * y)/Y) + 2 * A)
ax3.plot(y,p)    

f:id:bitop:20180115053703p:plain

f:id:bitop:20180127062914p:plain

f:id:bitop:20180127063015p:plain