Displaying-Figures-in-Python
import plotly
import plotly.graph_objects as go

fig = go.Figure(
    data=[go.Bar(y=[2, 1, 3])],
    layout_title_text="A Figure Displayed with fig.show()"
)
fig.show()
import plotly
import plotly.graph_objects as go

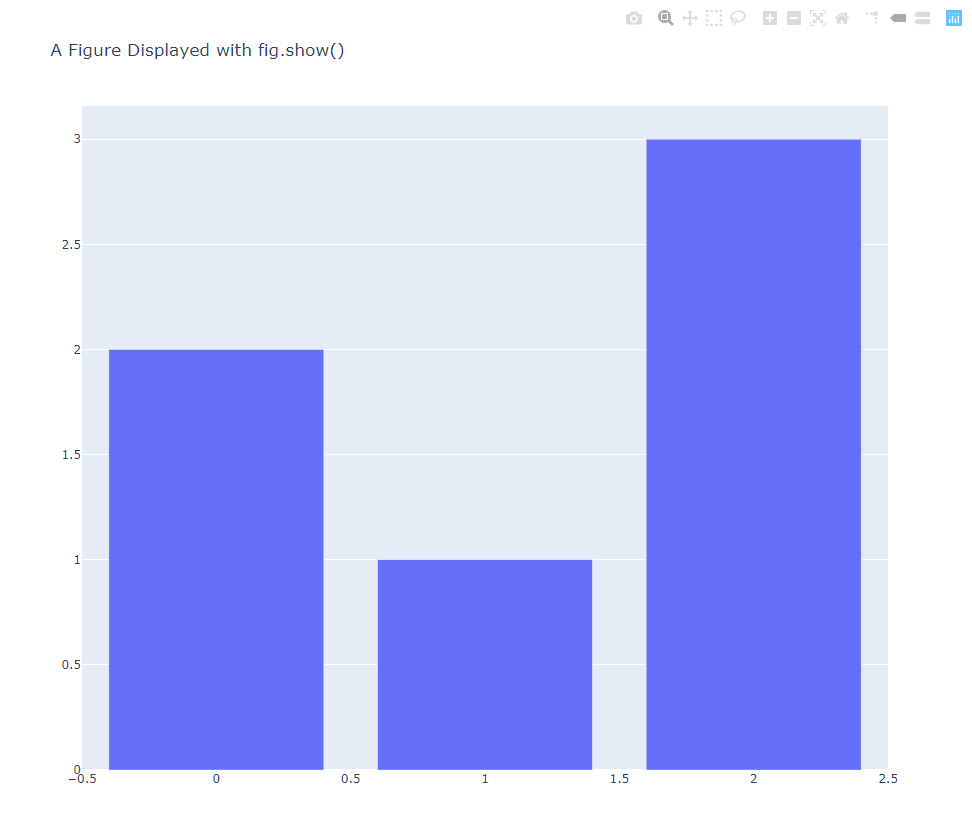
data = [go.Bar(y = [20,10,30])]
plotly.offline.plot(data)
import plotly.io as pio
print(pio.renderers)

#VSCODE環境では実行できなかった。Jupyter notebook環境で実行
import plotly
import plotly.io as pio
import plotly.graph_objects as go

png_renderer = pio.renderers["png"]
png_renderer.width = 500
png_renderer.height = 500

pio.renderers.default = "png"

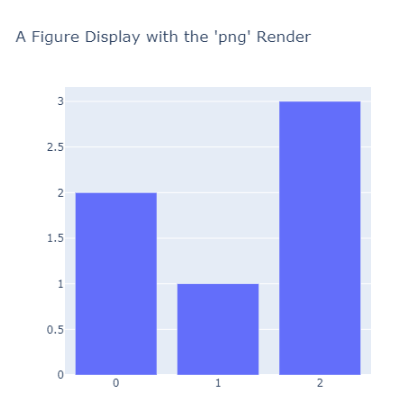
fig = go.Figure(
    data = [go.Bar(y=[2,1,3])],
    layout_title_text="A Figure Display    with the 'png' Render"
)
fig.show()
Creating and Updating Figures in Python
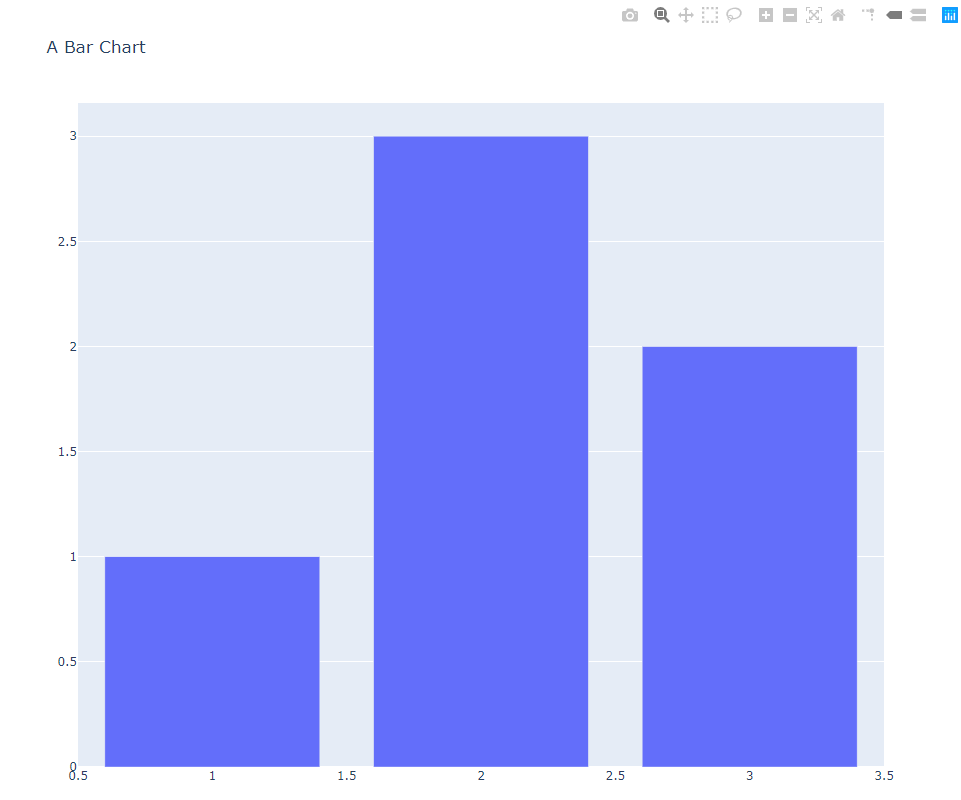
fig = {
    "data": [{"type": "bar",
              "x": [1, 2, 3],
              "y": [1, 3, 2]}],
    "layout": {"title": {"text": "A Bar Chart"}}
}

# To display the figure defined by this dict, use the low-level plotly.io.show function
# この辞書で定義された図を表示するには、低レベルのplotly.io.show関数を使用します
import plotly.io as pio
pio.show(fig)
import plotly.graph_objects as go
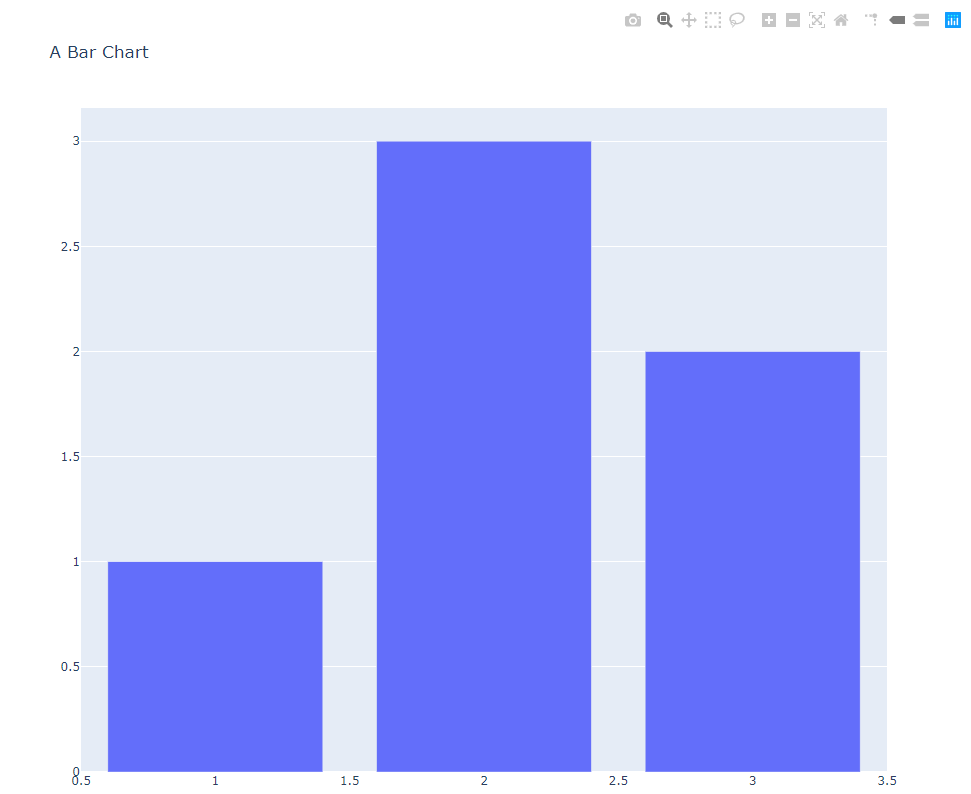
fig = go.Figure(
    data=[go.Bar(x=[1, 2, 3], y=[1, 3, 2])],
    layout=go.Layout(
        title=go.layout.Title(text="A Bar Chart")
    )
)
fig.show()
import plotly.express as px
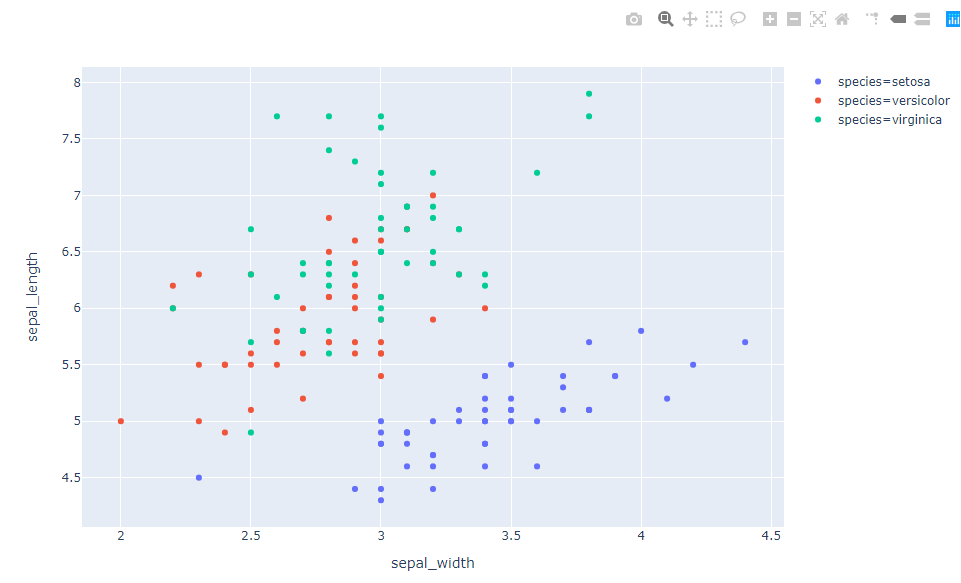
iris = px.data.iris()
fig = px.scatter(iris, x="sepal_width", y="sepal_length", color="species")

# If you print fig, you'll see that it's just a regular figure with data and layout
# print(fig)

fig.show()
import numpy as np
import plotly.figure_factory as ff

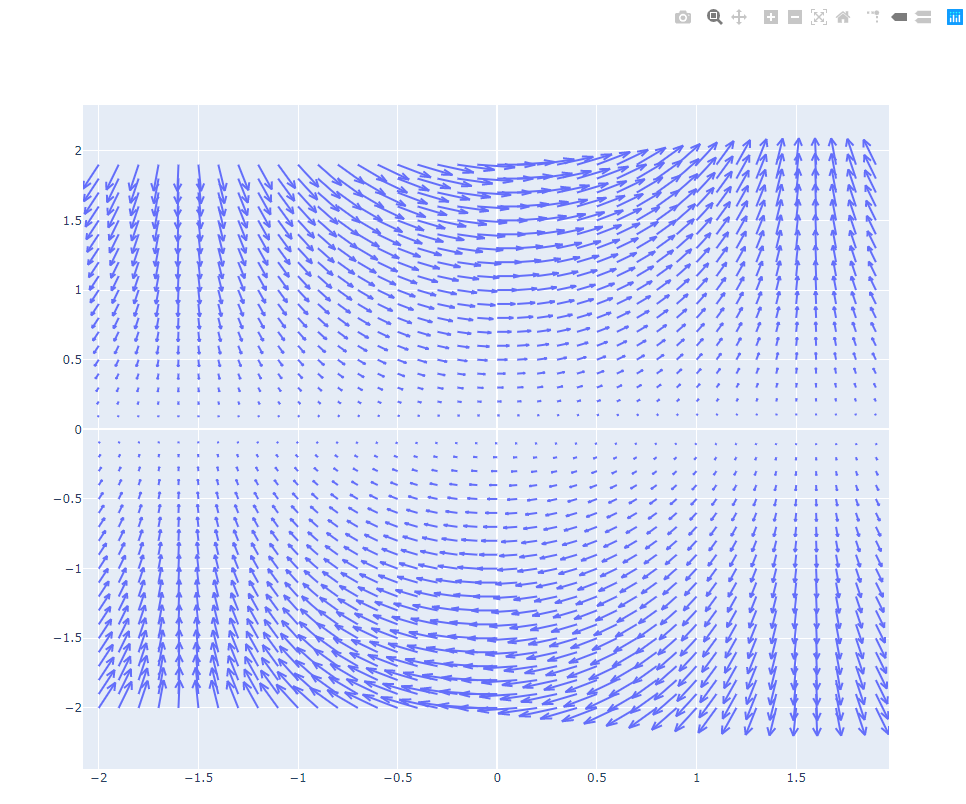
x1,y1 = np.meshgrid(np.arange(-2, 2, .1), np.arange(-2, 2, .1))
u1 = np.cos(x1)*y1
v1 = np.sin(x1)*y1

fig = ff.create_quiver(x1, y1, u1, v1)
fig.show()
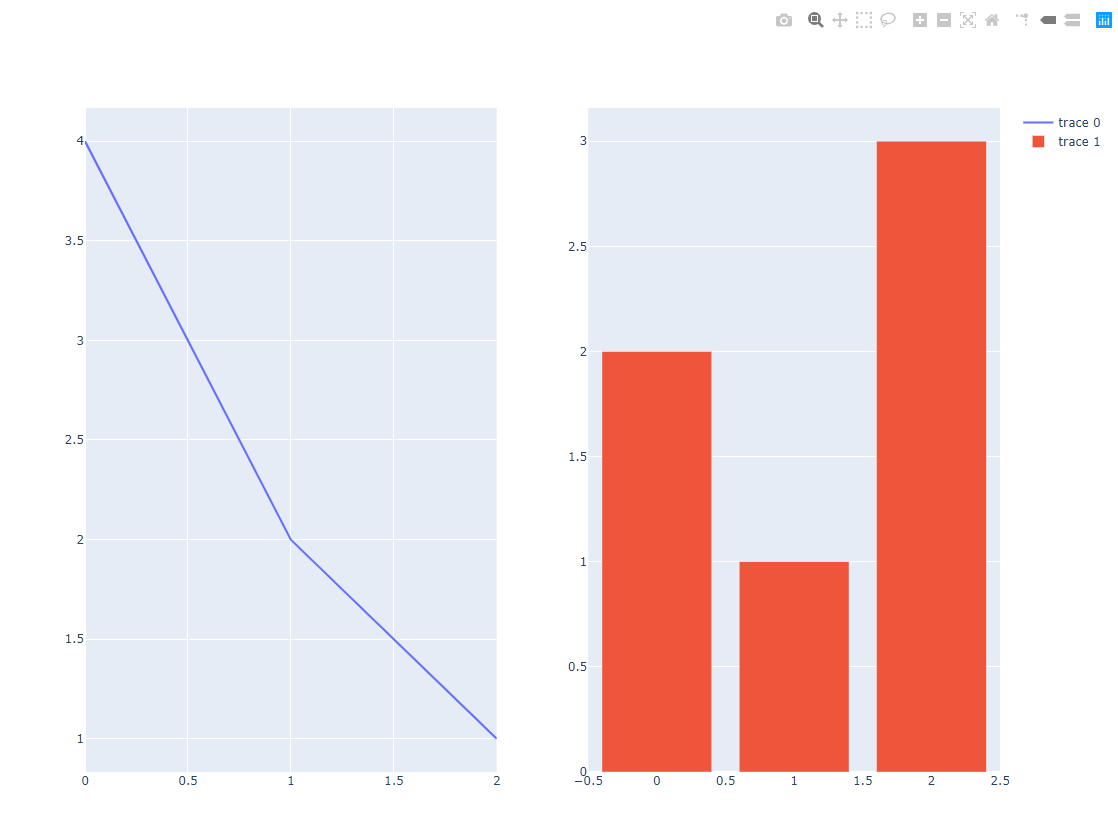
import plotly.graph_objects as go
from plotly.subplots import make_subplots
fig = make_subplots(rows=1, cols=2)
fig.add_trace(go.Scatter(y=[4, 2, 1], mode="lines"), row=1, col=1)
fig.add_trace(go.Bar(y=[2, 1, 3]), row=1, col=2)
fig.show()
import plotly.graph_objects as go
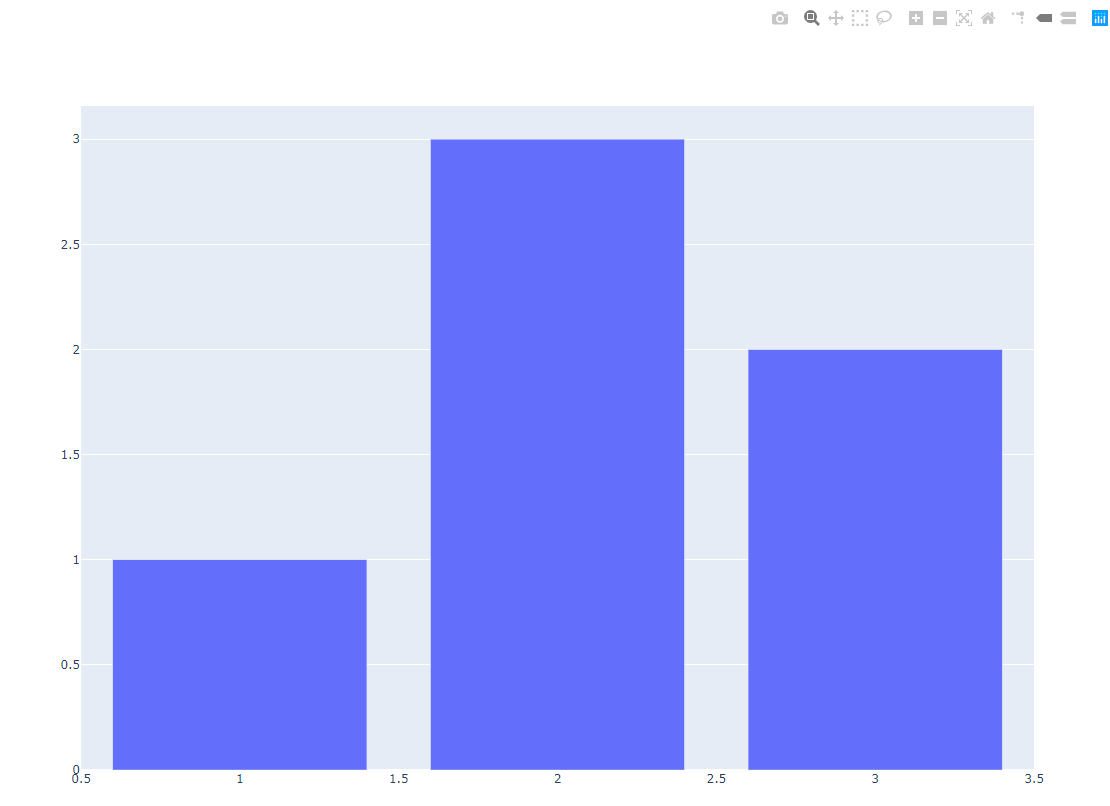
fig = go.Figure()
fig.add_trace(go.Bar(x=[1, 2, 3], y=[1, 3, 2]))
fig.show()
import plotly.graph_objects as go
import plotly.express as px
iris = px.data.iris()
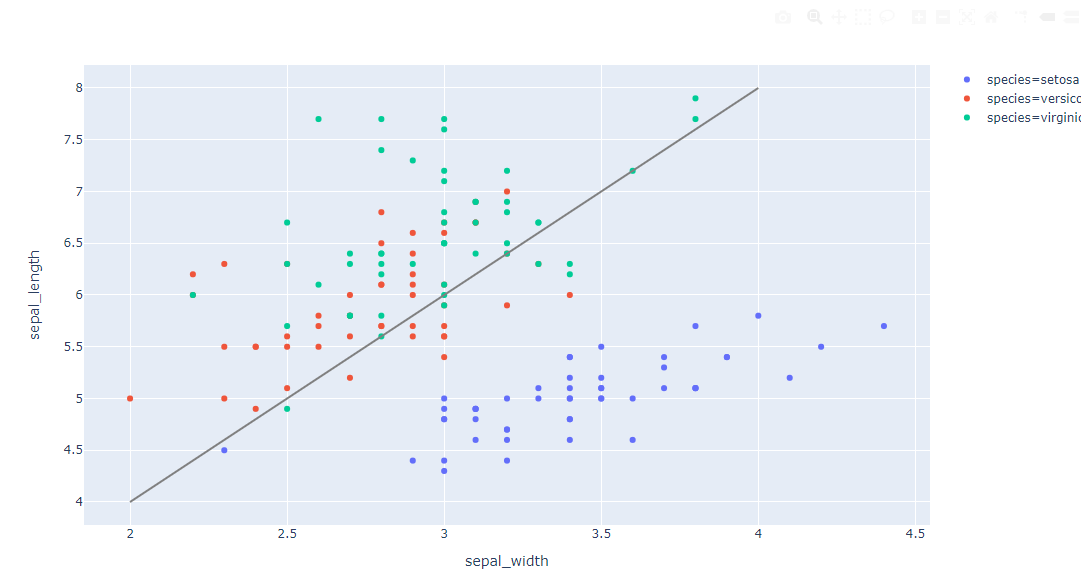
fig = px.scatter(iris, x="sepal_width", y="sepal_length", color="species")
fig.add_trace(
    go.Scatter(
    x=[2, 4],
    y=[4, 8],
    mode="lines",
    line=go.scatter.Line(color="gray"),
    showlegend=False)
)
fig.show()
