10.2 対話型セッションの開始
p224ページのipython [notebook | qt]とあるが
ipython qtではエラーがでる。
多分ipython qtconsoleまたはjupyter qtconsole
%matplotlib inline
import pandas as pd
import numpy as np
import matplotlib.pyplot as plt
import matplotlib
import json
10.3 pyplotのグローバル状態を使った対話型プロット
period_rangeメソッドの挙動
#periods引数は期間数のようである
#頻度はM,d,hが指定できるようである、yはエラーがでる
#x = pd.period_range('2017-10-01',periods=7,freq='y')
#print(x)
x = pd.period_range('2017-10-01',periods=7,freq='M')
print(x)
x = pd.period_range('2017-10-01',periods=7,freq='d')
print(x)
x = pd.period_range('2017-10-01',periods=7,freq='h')
print(x)
#to_timestampメソッドは期間の開始をタイムスタンプに変換する
print(x.to_timestamp())
#to_pydatetimeメソッドはDatetimeIndexをdatetime.datetimeオブジェクト(numpyのdarray)に変換する
print(x.to_timestamp().to_pydatetime())
print(type(x.to_timestamp().to_pydatetime()))
PeriodIndex(['2017-10', '2017-11', '2017-12', '2018-01', '2018-02', '2018-03',
             '2018-04'],
            dtype='period[M]', freq='M')
PeriodIndex(['2017-10-01', '2017-10-02', '2017-10-03', '2017-10-04',
             '2017-10-05', '2017-10-06', '2017-10-07'],
            dtype='period[D]', freq='D')
PeriodIndex(['2017-10-01 00:00', '2017-10-01 01:00', '2017-10-01 02:00',
             '2017-10-01 03:00', '2017-10-01 04:00', '2017-10-01 05:00',
             '2017-10-01 06:00'],
            dtype='period[H]', freq='H')
DatetimeIndex(['2017-10-01 00:00:00', '2017-10-01 01:00:00',
               '2017-10-01 02:00:00', '2017-10-01 03:00:00',
               '2017-10-01 04:00:00', '2017-10-01 05:00:00',
               '2017-10-01 06:00:00'],
              dtype='datetime64[ns]', freq='H')
[datetime.datetime(2017, 10, 1, 0, 0) datetime.datetime(2017, 10, 1, 1, 0)
 datetime.datetime(2017, 10, 1, 2, 0) datetime.datetime(2017, 10, 1, 3, 0)
 datetime.datetime(2017, 10, 1, 4, 0) datetime.datetime(2017, 10, 1, 5, 0)
 datetime.datetime(2017, 10, 1, 6, 0)]
<class 'numpy.ndarray'>
np.random.seed(9989) # we want to generate the same 'random' line sets
x = pd.period_range(pd.datetime.now(),
periods=200, freq='d')
x = x.to_timestamp().to_pydatetime()
#cumsumは累積和
y = np.random.randn(200,3).cumsum(0)
#p225の下から10行目に「200のタイムスロットをもつy軸とx軸を補う...」とあるがx軸とy軸がテレコでは?
#また次の行に(line)plotメソッドとあるがplt.plotメソッドでは?
plots = plt.plot(x, y)

10.3.1 Matplotlibの設定
http://bit.ly/1ZWSMKA (http://matplotlib.org/1.2.1/api/matplotlib_configuration_api.html)
http://bit.ly/1UTaxJ1 (http://matplotlib.org/1.4.0/users/customizing.html#the-matplotlibrc-file)
import matplotlib as mpl
mpl.rcParams['lines.linewidth'] = 2

mpl.rcParams['lines.color'] = 'r'
10.3.4 ラベルと凡例
10.3.5 タイトルと軸ラベル
#凡例の位置は色々設定できる
#'best','upper right','upper left','lower left','lower right','right',
#'center left','center right','lower center','upper center','center'
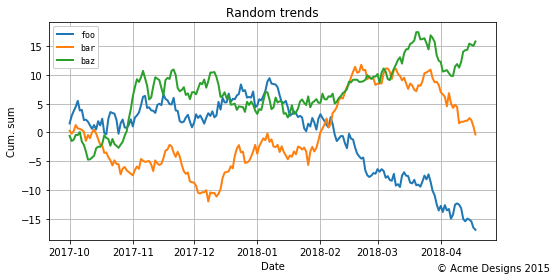
plots = plt.plot(x, y, label='')
plt.gcf().set_size_inches(8, 4)
#propはfontのプラパティを設定している
plt.legend(plots, ('foo', 'bar', 'baz'), loc='best', framealpha=0.25,
prop={'size':'small', 'family':'monospace'})
plt.title('Random trends')
plt.xlabel('Date')
plt.ylabel('Cum. sum')
plt.grid(True)
plt.figtext(0.995, 0.01, u'© Acme Designs 2015',
ha='right', va='bottom')
def generate_random_data(seed=9989):
    np.random.seed(9989)
    x = pd.period_range(pd.datetime.now(), periods=200, freq='d')
    x = x.to_timestamp().to_pydatetime()
    y = np.random.randn(200,3).cumsum(0)
    return x,y
10.4.1 軸とサブプロット
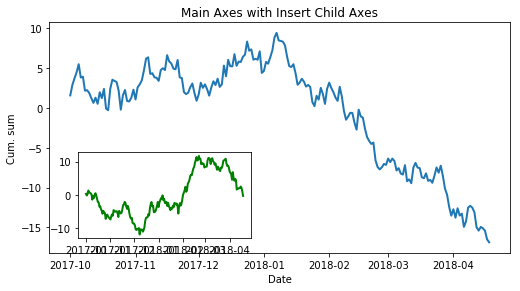
fig = plt.figure(figsize=(8,4))
#--- Main Axes
#fig.add_axesメソッド
#FigureインスタンスにAxesインスタンスを追加する
# Figureの座標は
# (0,1)------------------(1,1)
# |                          |
# |                          |
# |                          |
# |                          |
# (0,0)------------------ (1,0)
# となっている
# add_axes引数の第一、第二引数はAxes座標の左下隅のx、y座標をFigureの座標で指定
# 第三、第四引数はAxesの幅と高さでFigureの座標の比率(0.8は80%という意味)

ax = fig.add_axes((0.1,0.1,0.8,0.8))
ax.set_title('Main Axes with Insert Child Axes')
#yには200行3列のランダムな数が入っている
ax.plot(x, y[:,0])
ax.set_xlabel('Date')
ax.set_ylabel('Cum. sum')
#--- Inserted Axes
ax = fig.add_axes([0.15,0.15,0.3,0.3])
ax.plot(x, y[:,1], color='g')
#目盛りを省略させている
ax.set_xticks([]);
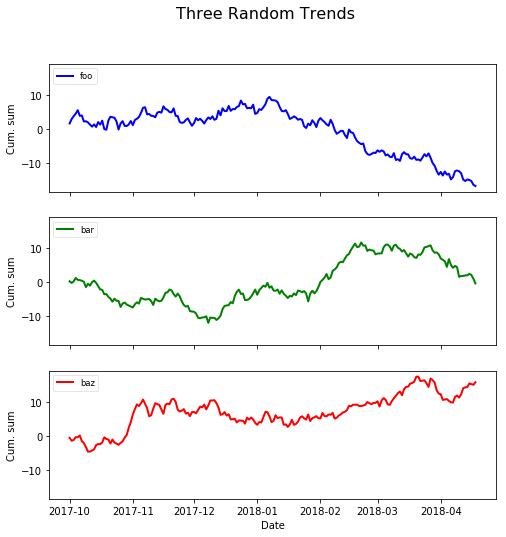
fig, axes = plt.subplots(nrows=3,
ncols=1, sharex=True, sharey=True, figsize=(8,8))
labelled_data = zip(y.transpose(), ('foo', 'bar', 'baz'), ('b', 'g', 'r'))
fig.suptitle('Three Random Trends', fontsize=16)
for i, ld in enumerate(labelled_data):
    ax = axes[i]
    ax.plot(x, ld[0], label=ld[1], color=ld[2])
    ax.set_ylabel('Cum. sum')
    ax.legend(loc='upper left', framealpha=0.5, prop={'size':'small'})
axes[-1].set_xlabel('Date')
10.5 プロットの種類
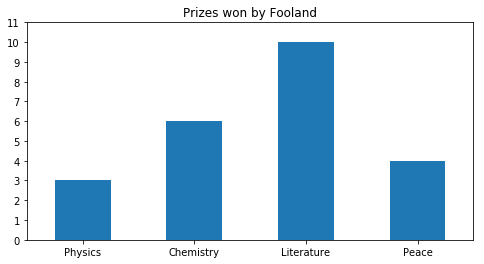
labels = ["Physics", "Chemistry", "Literature", "Peace"]
data =   [3, 6, 10, 4]

xlocations = np.array(range(len(data)))+0.5 #[0.5,1.5,2.5,3.5]ができる,この座標は棒グラフの中心を指定している
bar_width = 0.5
plt.bar(xlocations, data, width=bar_width)
plt.yticks(range(0, 12))
plt.xticks(xlocations + bar_width/2*0, labels) #+bar_width/2分右によるとラベルが棒グラフの右端に来てしまうのでオミット
plt.xlim(0, xlocations[-1]+bar_width*1) #bar_width*2だと右領域が広すぎてしまうので1にした
plt.title("Prizes won by Fooland")
plt.gca().get_xaxis().tick_bottom()
plt.gca().get_yaxis().tick_left()
plt.gcf().set_size_inches((8,4))
labels = ["Physics", "Chemistry", "Literature", "Peace"]
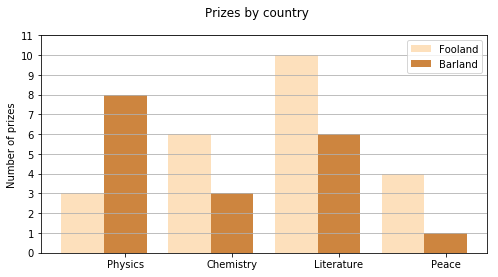
foo_data =   [3, 6, 10, 4]
bar_data = [8, 3, 6, 1]

fig, ax = plt.subplots(figsize=(8, 4))
width = 0.4 # bar width
xlocs = np.arange(len(foo_data))
ax.bar(xlocs-width, foo_data, width, color='#fde0bc', label='Fooland')
ax.bar(xlocs, bar_data, width, color='peru', label='Barland')
# --- labels, grids and title, then save
ax.set_yticks(range(12))
ax.set_xticks(ticks=range(len(foo_data)))
ax.set_xticklabels(labels)
ax.yaxis.grid(True)
ax.legend(loc='best')
ax.set_ylabel('Number of prizes')
fig.suptitle('Prizes by country')
labels = ["Physics", "Chemistry", "Literature", "Peace"]
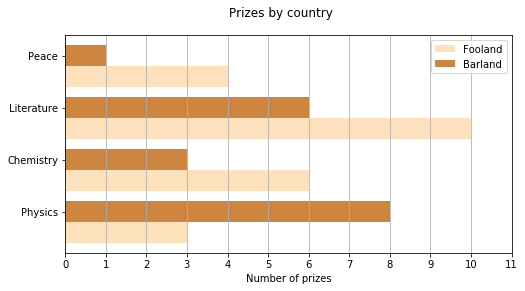
foo_data =   [3, 6, 10, 4]
bar_data = [8, 3, 6, 1]

fig, ax = plt.subplots(figsize=(8, 4))
width = 0.4 # bar width
ylocs = np.arange(len(foo_data))
ax.barh(ylocs-width, foo_data, width, color='#fde0bc', label='Fooland')
ax.barh(ylocs, bar_data, width, color='peru', label='Barland')
# --- labels, grids and title, then save
ax.set_xticks(range(12))
ax.set_yticks(ticks=range(len(foo_data)))
ax.set_yticklabels(labels)
ax.xaxis.grid(True)
ax.legend(loc='best')
ax.set_xlabel('Number of prizes')
fig.suptitle('Prizes by country')
labels = ["Physics", "Chemistry", "Literature", "Peace"]
foo_data =   [3, 6, 10, 4]
bar_data = [8, 3, 6, 1]

fig, ax = plt.subplots(figsize=(8, 4))
width = 0.8 # bar width
xlocs = np.arange(len(foo_data))+width/2 #左端のグラフが潰れてしまうのでオフセットした
ax.bar(xlocs, foo_data, width, color='#fde0bc', label='Fooland')
ax.bar(xlocs, bar_data, width, color='peru', label='Barland', bottom=foo_data)
# --- labels, grids and title, then save
ax.set_yticks(range(18))
ax.set_xticks(ticks=np.array(range(len(foo_data))) + width/2)
ax.set_xticklabels(labels)
ax.set_xlim(-(1-width), xlocs[-1]+1)
ax.yaxis.grid(True)
ax.legend(loc='best')
ax.set_ylabel('Number of prizes')
fig.suptitle('Prizes by country')

10.5.2 散布図
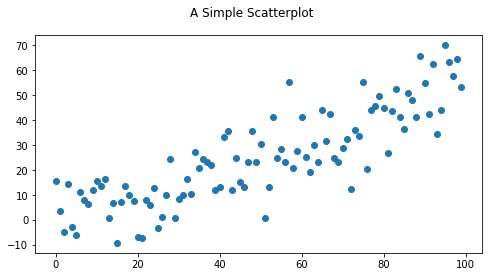
np.random.seed(9989)
num_points = 100
gradient = 0.5
x = np.array(range(num_points))
#np.random.randnは標準分布に従った乱数を生成
y = np.random.randn(num_points) * 10 + x*gradient
fig, ax = plt.subplots(figsize=(8, 4))
ax.scatter(x, y)

fig.suptitle('A Simple Scatterplot')
np.random.seed(9989)
num_points = 100
gradient = 0.5
x = np.array(range(num_points))
y = np.random.randn(num_points) * 10 + x*gradient
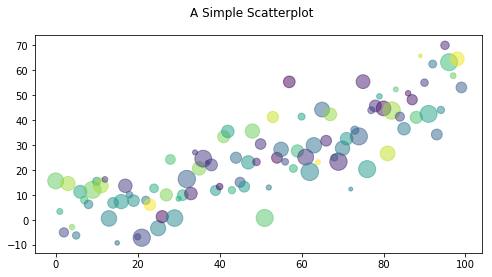
fig, ax = plt.subplots(figsize=(8, 4))
colors = np.random.rand(num_points)
size = np.pi * (2 + np.random.rand(num_points) * 8) ** 2
ax.scatter(x, y, s=size, c=colors, alpha=0.5)

fig.suptitle('A Simple Scatterplot')
np.random.seed(9989)
num_points = 100
gradient = 0.5
x = np.array(range(num_points))
y = np.random.randn(num_points) * 10 + x*gradient
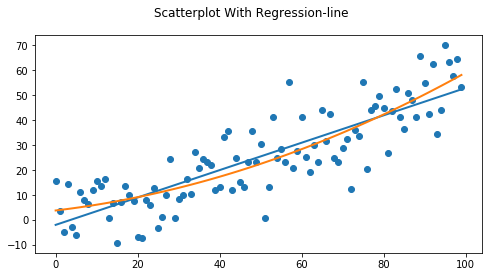
fig, ax = plt.subplots(figsize=(8, 4))
ax.scatter(x, y)
#1次式、2次式、多項式の最小二乗法を解いてくれる、すぐれもの
#データ(x、y)から直線y=a*x+bの傾きa、切片bを算定する
#第三引数の1は1次式という意味
m, c = np.polyfit(x, y ,1)
#2次式でも解いてみてプロット
#ここを参照
#http://ailaby.com/least_square/
m2,m1,c1 = np.polyfit(x, y ,2)
ax.plot(x, m*x + c)
ax.plot(x, m2*x**2 + m1*x + c1)
fig.suptitle('Scatterplot With Regression-line')
10.6 Seaborn
import seaborn as sns
data = pd.DataFrame({'dummy x':x, 'dummy y':y})
data.head()
| dummy x | dummy y | |
|---|---|---|
| 0 | 0 | 15.647707 |
| 1 | 1 | 3.365661 |
| 2 | 2 | -5.027476 |
| 3 | 3 | 14.574908 |
| 4 | 4 | -2.916389 |
sns.lmplot('dummy x', 'dummy y', data, size=4, aspect=2)

sns.lmplot('dummy x', 'dummy y', data, size=4, aspect=2,
scatter_kws={"color": "slategray"},
           line_kws={"linewidth": 2, "linestyle":'--', "color": "seagreen"},
           markers='D', ci=68
           )

10.6.1 FaceGrid
#https://github.com/mwaskom/seaborn-data

tips = sns.load_dataset('tips')
tips.head()
| total_bill | tip | sex | smoker | day | time | size | |
|---|---|---|---|---|---|---|---|
| 0 | 16.99 | 1.01 | Female | No | Sun | Dinner | 2 |
| 1 | 10.34 | 1.66 | Male | No | Sun | Dinner | 3 |
| 2 | 21.01 | 3.50 | Male | No | Sun | Dinner | 3 |
| 3 | 23.68 | 3.31 | Male | No | Sun | Dinner | 2 |
| 4 | 24.59 | 3.61 | Female | No | Sun | Dinner | 4 |
g = sns.FacetGrid(tips, col="smoker", size=4, aspect=1)
g.map(plt.scatter, "total_bill", "tip")

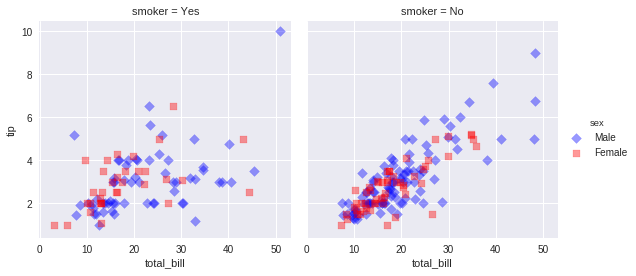
pal = dict(Female='red', Male='blue')
g = sns.FacetGrid(tips, col="smoker", hue="sex", palette=pal, size=4, aspect=1, hue_kws={"marker": ["D", "s"]})
g.map(plt.scatter, "total_bill", "tip", alpha=.4)
g.add_legend();
10.6.2 PairGrid
pal = dict(Female='red', Male='blue')
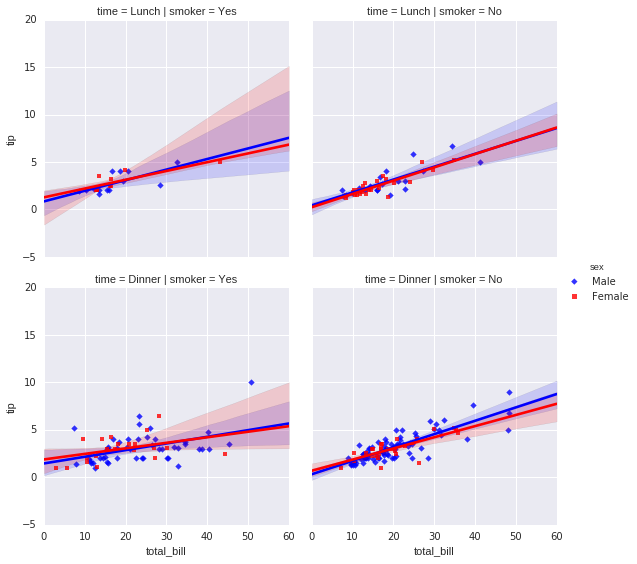
g = sns.FacetGrid(tips, col="smoker", row="time", hue="sex", palette=pal, size=4, aspect=1, hue_kws={"marker": ["D", "s"]})
g.map(sns.regplot, "total_bill", "tip")
g.add_legend();

pal = dict(Female='red', Male='blue')

sns.lmplot(x="total_bill", y="tip", hue="sex",size=4, aspect=1, markers=["D", "s"],
           col="smoker", row="time", data=tips, palette=pal
           );
#あやめのデータ・セット
iris = sns.load_dataset('iris')
iris.head()
| sepal_length | sepal_width | petal_length | petal_width | species | |
|---|---|---|---|---|---|
| 0 | 5.1 | 3.5 | 1.4 | 0.2 | setosa |
| 1 | 4.9 | 3.0 | 1.4 | 0.2 | setosa |
| 2 | 4.7 | 3.2 | 1.3 | 0.2 | setosa |
| 3 | 4.6 | 3.1 | 1.5 | 0.2 | setosa |
| 4 | 5.0 | 3.6 | 1.4 | 0.2 | setosa |
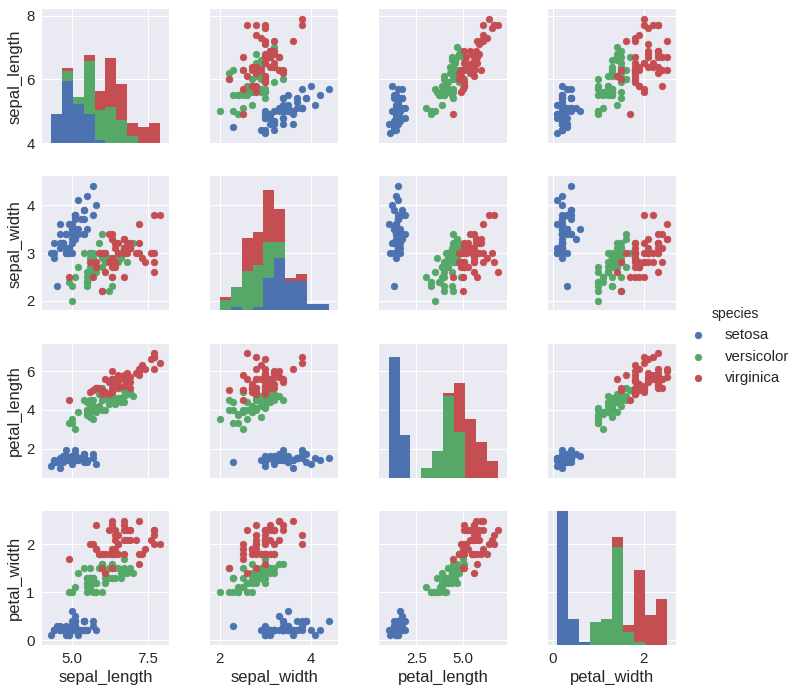
sns.set(font_scale=1.5)
g = sns.PairGrid(iris, hue="species")#, size=6, aspect=1)
g.map_diag(plt.hist)
g.map_offdiag(plt.scatter)
g.add_legend();
